Dietary Fat & Mortality

Executive summary
Please login to view this contentIntroduction
We are getting back to home turf this week – diet and disease. More specifically dietary fat and dying. We need to remember that, while the COVID-19 papers are being published at a rapid rate, the diet and health papers are still being published at some rate and we can’t let some of them slip through unaddressed. This is not just our home turf, it’s my absolute home turf, as my PhD was a systematic review of the evidence for the dietary fat guidelines, which were issued ostensibly to avoid deaths – especially from heart disease. Dietary fat, deaths and heart disease are my bread and butter, if you’ll pardon the phrase.
The paper that is the subject of this week’s note is precisely one of those that needs countering. It was published online on April 3rd, 2020 and is called “Association of types of dietary fats and all-cause and cause-specific mortality: A prospective cohort study and meta-analysis of prospective studies with 1,148,117 participants” (Ref 1). The lead author was Mohsen Mazidi. Some of you may recognise that name, as Mazidi did one of the most recent articles claiming that low carbohydrate diets are associated with higher death rates (Ref 2). This time his conclusion, along with many co-authors, was that total fat, and polyunsaturated fat are associated with lower mortality; but that saturated fat was associated with higher mortality.
The study
The study was one of those two part papers, like the Seidelmann et al low carb attack from August 2018 (Ref 3). Seidelmann et al revisited the Atherosclerosis Risk in Communities (ARIC) population study and then joined this revisit into a meta-analysis with other population studies. Mazidi et al did the same. Part 1 was a population study where the authors reviewed existing data for 24,144 participants from the National Health and Nutrition Examination Surveys (NHANES) 1999-2010. They then added these findings to several meta-analyses along with other population studies.
Part 1
The NHANES participant questionnaires are reported here (Ref 4). As this is a diet study, the dietary questionnaire is the important one. You can see the questions and summary of replies here (Ref 5). The Food Frequency Questionnaire (FFQ) was based on the person’s recollection of what they consumed in the 24 hour period before the dietary interview, back in 1999.
The characteristics of the participants were presented in Table 1 in the Mazidi et al paper. The average (mean) age was 49.6 and 48.5% were men. Table 1 split the participants into four equal groups (quartiles) from the lowest to the highest total fat intake. Using equal sized groups is the fairest way to split people. However, the split revealed something extraordinary. I’ve extracted the relevant numbers from Table 1 to put them in a table below to explain why. The table below shows the intake in grams (with calories in brackets) of carbohydrate, protein, and fat per quartile. From this, overall average daily calorie intake can be totalled.
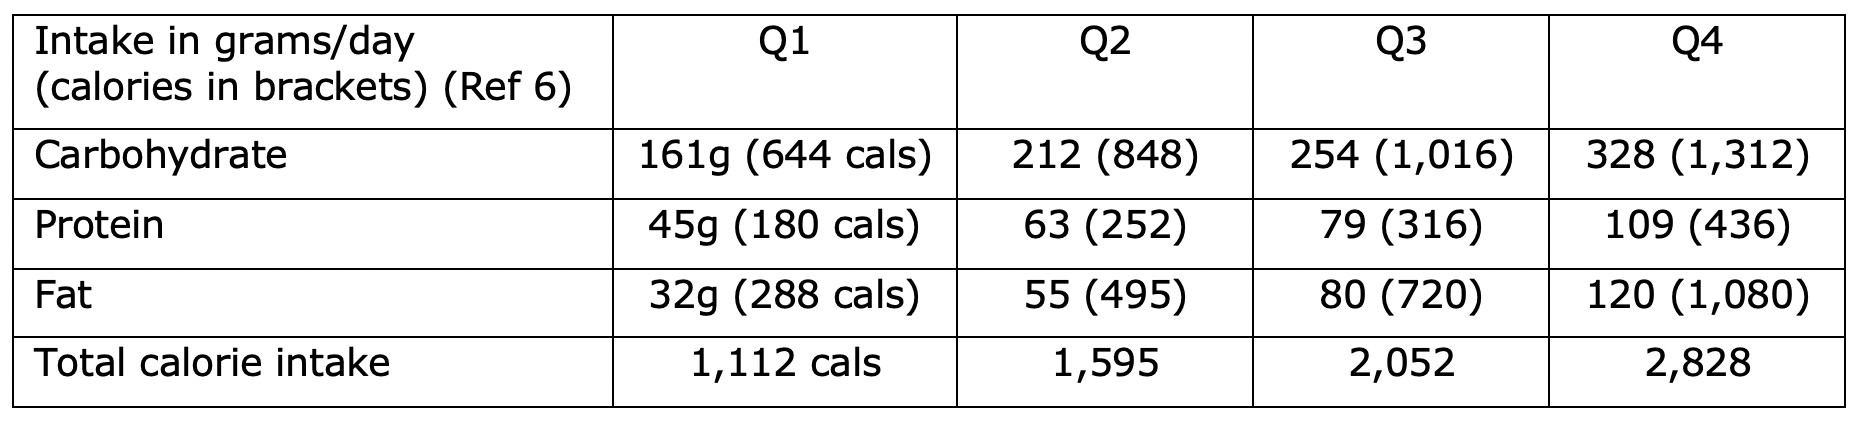
You should be able to spot the showstopper straight away. The lowest fat intake group (Q1) averaged 1,112 calories a day – or rather – that’s what they recalled eating when they completed the questionnaire. That is absurd. Normally extremely low (and often extremely high) calorie intakes are discarded as clearly being inaccurate. Not this study – this study used the absurdity as the baseline! People in Q4 consumed, on average, 2.5 times the number of calories as people in Q1 and the researchers didn’t stop and think?
This is not the first time that attacks on low carbohydrate diets and/or dietary fat have got the basics wrong. In Seidelmann et al, the FFQ intake was also absurd. The calorie intake in that study ranged from 1,558 calories per day in the lower carbohydrate group to 1,660 calories in the middle carbohydrate group. No group apparently consumed more than an average of 1,660 calories a day in an American study covering the past 25 years. Really?
You might think, provided that Mazidi et al adjusted for energy intake, this wouldn’t matter. 1) it would – because the differences reported are so vast that they clearly make a mockery of the entire food intake data, and 2) even worse, the Mazidi el al paper does not seem to have adjusted for energy intake. The notes beneath Table 2 describe Model 1 and Model 2 and what each adjusted for. The most adjusted model, Model 2, adjusted for: “age, race, education, marital status, poverty to income ratio, physical activity, smoking, alcohol consumption, dietary cholesterol, body mass index and hypertension, non-HDL cholesterol.” No adjustment for energy intake was reported.
A passage in the text of the paper claims that Model 1 was adjusted for energy intake, but the table notes do not corroborate this. Additionally, the supplemental file reported that the Mazidi et al study did not adjust for energy intake. I emailed Mazidi, the corresponding author, on May 11th, to ask if energy intake was adjusted for, but he’s not corresponding as yet.
Notwithstanding that the entire Part 1 should be disregarded, the claims that the authors tried to make were as follows:
– An inverse association was claimed between total fat intake and mortality. Those in Q4 with the highest fat intake had the lowest risk of dying. [The numbers for Q4 vs Q1 were HR 0.90 (0.82-0.99).]
– An inverse association was claimed between polyunsaturated fat intake (PUFAs) and mortality. Those in Q4 with the highest PUFA intake had the lowest risk of dying. [The numbers for Q4 vs Q1 were HR 0.81 (0.78-0.84).]
– A positive association was claimed between saturated fat intake (SFAs) and mortality. Those in Q4 with the highest SFA intake had the highest risk of dying. [The numbers for Q4 vs Q1 were HR 1.08 (1.04-1.11).]
– There was nothing of statistical significance found for monounsaturated fats (MUFAs), by the way.
This paper thus tries to make the case that the long-awaited US Dietary Guidelines for 2020 will no doubt try to make i) we’re not so worried about total fat anymore and ii) that’s because we’d like you to eat lots of PUFAs, but not SFAs. Let’s take a quick look at this.
Saturated vs unsaturated fats
The claim that total fat and PUFAs are associated with lower mortality, while SFA is associated with higher mortality (and MUFAs aren’t associated either way) just doesn’t make sense. As I have been trying to hammer home for many years, every food that contains fat contains all three fats (Ref 7). There are no exceptions. Every time we consume either unsaturated fat (MUFA or PUFA), we consume saturated fat – no exceptions. The only food group with more saturated than unsaturated fat is dairy products. Meat, fish, eggs, nuts, seeds, lard (lol!) have more unsaturated than saturated fat. (The single highest fat in meat is usually MUFAs).
The Mazidi et al paper provided a reference for the sources of total fat, MUFAs, PUFAs and SFAs in the diet (Ref 8). Total fat and SFAs are in the main paper; MUFAs and PUFAs are in the supplemental material for that reference. In what follows, the definition of “other fats and oils” is essentially fats and oils as found in junk food. “Margarine and butter” are in their own category. “Salad dressings and mayonnaise” were another separate category. “Other fats and oils” was defined as: “those used in yeast breads and rolls; ready-to-eat cereals; pasta; biscuits, corn bread, pancakes, tortillas; crackers, popcorn, pretzel, chips; cakes, cookies, quick bread, pastry, pie; and milk desserts (e.g., ice cream, puddings, and custards).”
The following lists the top 3 sources of each type of fat intake for all adults (aged 19 and over) (from Ref 8):
– Total fat: The top 3 sources of total fat were 1) Other fats and oils 2) Cheese and 3) Beef.
– MUFAs: The top 3 sources of MUFAs were 1) Other fats and oils 2) Beef and 3) “Cakes, cookies, quick bread, pastries, pie.”
– PUFAs: The top 3 sources of PUFAs were 1) Salad dressings and mayonnaise, 2) Other fats and oils, and 3) “Crackers, popcorn, pretzels, chips.”
– SFAs: The top 3 sources of SFAs were 1) Cheese 2) Beef and 3) Other fats and oils.
The Mazidi et al assertions raise the following conundrums:
– Cheese, beef and “fats and oils in junk food” are associated with lower mortality for their total fat content, but higher mortality for their SFA content.
– It’s ‘better’ to have fats and oils in junk food in the top slot than in the third slot (total fat vs SFAs again).
– Beef in the top three is good when it comes to total fat, neutral for MUFAs, but bad when it comes to SFAs.
– The top 3 sources of PUFAs are all processed foods. This is better for mortality than consuming cheese and beef.
The nutrients paper also revealed that the top four sources of protein were (in order) poultry, beef, cheese, and milk. The top two sources of calcium were milk and cheese. The top source of vitamin D was milk. The top source of potassium was milk. Dairy products contributed vital nutrients to the American diet, but Mazidi et al damn them in the name of saturated fat – while simultaneously recognising them as top contributors to total fat, which they claim is associated with lower mortality.
None of this makes sense unless you see it as confirmation of the confirmation bias of the authors. The author list at the head of the paper noted that it was written “on behalf of the International Lipid Expert Panel” – a group defined by belief in the diet heart hypothesis (saturated fat raises LDL-cholesterol and causes heart disease).
Part 2
Part 1 should have been discarded, but Part 1 was, instead, carried into Part 2 to be added to other population studies in meta-analysis. The fourth major part of my PhD was an examination of the evidence from population/cohort studies for any relationship between total fat and saturated fat and deaths from coronary heart disease (CHD) (Ref 9). i.e. precisely what Mazidi et al have just done. When I did this, there were no statistically significant findings – either way – not positive or inverse. Neither total fat intake nor saturated fat intake had a significant impact on deaths from CHD. This finding also followed examination of superior evidence – that from randomised controlled trials – which also confirmed that there were no statistically significant findings.
I was surprised therefore to find Mazidi et al claiming: “In the meta-analysis of 29 prospective cohorts (n = 1,148,117) we found a significant inverse association between total fat (0.89, 0.82-0.97), MUFA (0.93, 0.87-0.99) and PUFA (0.86, 0.80-0.93) consumption and all-cause mortality.” Part 2 found nothing for SFA and all-cause mortality. Part 2 found nothing for SFA and Cardiovascular Disease (CVD) mortality. So the researchers went looking further and found “A significant association between SFA intake and CHD mortality (1.10, 1.01–1.20).”
As with Part 1, Part 2 tried to make the same claim – higher total fat is good – so long as it’s unsaturated and not saturated. There were a number of issues with Part 2:
1) First, it was misleading to claim “in the meta-analysis of 29 studies” up front, as the meta-analysis for total fat and all-cause mortality involved just 7 studies – with men and women split in 4 of them. Ditto, the MUFA meta-analysis involved just 10 studies with 5 split further. The PUFA meta-analysis involved 9 studies, with 6 split further. The SFA meta-analysis involved 14 studies, with 5 split further.
2) The Mazidi et al fiasco from Part 1 ended up in every one of the meta-analyses, making all of them untrustworthy. It was also the largest study (in person years) in the SFA/CHD analysis and the largest studies carry the most weight in meta-analysis and thus this would have had a disproportionate impact on claimed findings. Some findings from the meta-analyses were so close to the line of no effect that this would likely have made the sole difference.
3) I spotted many errors without even looking…
– The paper reported that 29 studies were found and used in meta-analysis. There were only 28 in the supplemental file. One was missing from Tables 2 and 3 in the supplemental file and from the paper references. This turned out to be Virtanen 2014 (Ref 10). This study was used in the SFA meta-analysis. Three studies were missing from the paper references (Chien, Shekelle and Kushi).
– Mazidi et al reported their own study incorrectly in Table 3 of the supplemental file. They reported 24,144 people under “number of cases” and 6,581 under “number of subjects.” It should have been 24,144 under “number of subjects” and 3,632 under “number of cases” and it should have specified that 714 of these were CHD related deaths.
– With or without this error corrected, I could not get their own data to total 1,148,117 for the number of subjects or 253,592 for the number of deaths, which were the numbers that they claimed were included in meta-analysis.
– Mazidi et al reported two of their own results from meta-analysis incorrectly. The abstract reported the Hazard Ratios and confidence intervals for MUFAs and total mortality to be 0.93 (0.87-0.99). Figure 4 reported it to be 0.94 (0.89-0.99). The abstract reported the Hazard Ratios and confidence intervals for PUFAs and total mortality to be 0.86 (0.80-0.93). Figure 5 reported it to be 0.89 (0.84-0.94).
By this point I had no faith in the entire paper.
I’m going to focus on the SFA claim to illustrate further how unreliable the paper is:
– McGee et al (1985) was correctly reported as having examined SFA and having CHD mortality data in Table 3 of the supplemental file, but it was not included in the SFA meta-analysis. McGee concluded: “No significant relationships are found between dietary saturated fatty acids (SFA, measured in grams) or dietary cholesterol (measured in milligrams) and any of the specific causes of death examined.” This paper should have been included.
– Mann et al (1997) only examined SFA from animal foods and thus missed all SFA in plant foods. This paper also failed to adjust for alcohol, exercise, or BMI – despite noting that a BMI greater than 25 was associated with an almost 4 times higher death rate. The Mann et al study provided the second highest risk ratio for SFA and mortality in Mazidi et al’s Figure 3, despite being based on 64 deaths (unadjusted) in 143,000 person years. For many reasons, this paper should have been excluded.
– Trichopoulou et al (2006) was included in the SFA meta-analysis and yet this reported on CVD, not CHD, deaths. All the other papers that examined CVD and not CHD were rightly excluded from the SFA and CHD analysis. The data were also extracted incorrectly from this paper. There were 80 total deaths and 46 from CVD, not the 80 CVD deaths, which was the only number reported. Trichopoulou et al found strongly against SFA, as you can see from Figure 3 in the main Mazidi paper. This paper should have been excluded.
– Tucker et al (2005) was reported in the SFA/CHD mortality meta-analysis as having a Hazard Ratio of 1.720 (0.898-3.294) I cannot see where these numbers have come from in the Tucker paper. This was a multi-factorial paper looking at combinations of low/high SFA and low/high fruit and veg intake, but those numbers cannot be found in the paper.
– Similarly, and I am extremely familiar with all of these papers and I have re-examined them all, I cannot find the numbers used in the SFA meta-analysis for Shekelle (1981) or Kushi (1985) or Goldbourt (1993). I have no idea why Goldbourt A and B are presented when Goldbourt was one study of 10,059 male civil servants and municipal employees in Israel.
The usual issues
We must remember that this is nutritional epidemiology and thus it suffers from the same three flaws every time:
1) It can only suggest association, not causation.
The paper claims an association between total fat and unsaturated fat intake and lower mortality and an association between SFA intake and higher mortality. It cannot claim causation. The Bradford Hill criteria for possible causation are not even worth considering until the strength of association is approximately double. That would be a relative risk (RR) of 2, not just over 1. As Nina Teicholz shared when she saw this paper “RRs like 1.08 and 1.1 should just be laughed out of the room.”
2) The headline numbers are relative risk; the absolute risk difference is invariably tiny.
As shared above, the relative risks claimed were 1.08 in Part 1 (for SFA and total mortality) and 1.1 in Part 2 (for SFA and CHD mortality). We can calculate the absolute risk in Part 2. Notwithstanding that their numbers didn’t add up, I calculated that there were 3,990 deaths in 14 studies in 1,577,581 person years. That’s a total death rate of 0.25%. The 1.1 (10%) relative risk difference – notwithstanding that this figure is completely unreliable – would be the difference between a total death rate of 0.24% vs 0.26%. Who would care, even if this were causal, and it isn’t.
3) The healthy person confounder.
The third major flaw of every epidemiological study is the healthy person confounder. If there is an association between, say, consumption of saturated fat and health – is the saturated fat intake a marker of health, or the maker of health? If cheese, beef and other fats and oils are a reflection of people who eat cheeseburgers with fries and milkshakes, then who would be surprised that there’s an association? However, the overlap between cheese, beef and other fats and oils – as shown above – with total fat and the individual fats, undermines the researchers’ ability to claim cheese, beef and other fats and oils are both harmful and helpful.
There was an additional issue with this paper – as I found examining the subject for my PhD – that most of the dietary studies being used in meta-analysis today were undertaken long ago and on men. Many are not generalisable to women or populations today.
All dietary epidemiological studies also suffer from two further limitations:
4) The Food Frequency Questionnaire. Rarely has a paper shown the FFQ to be more unreliable than this study.
5) Incomplete adjustment of the data. We saw with Mann et al the failure to adjust for factors known to make a huge difference (BMI). The supplemental file revealed that several studies failed to adjust for several important factors that are known to impact mortality: alcohol, smoking, exercise and so on.
In conclusion, this is one of the worst papers I’ve seen for some time. This is now part of the literature continuing to attack saturated fat and it shouldn’t be. It is highly flawed. I’ve written to the journal to ask how they handle errors that got through peer review. I’ll update you on any developments.
References
Ref 1: Mazidi et al. Association of types of dietary fats and all-cause and cause-specific mortality: A prospective cohort study and meta-analysis of prospective studies with 1,148,117 participants. Clinical Nutrition. 2020. https://www.clinicalnutritionjournal.com/article/S0261-5614(20)30146-1/pdf
Ref 2: https://www.zoeharcombe.com/2019/05/low-carb-diets-and-mortality/
Ref 3: Seidelmann et al. Dietary carbohydrate intake and mortality: a prospective cohort study and meta-analysis. The Lancet Public Health 2018.
https://www.thelancet.com/journals/lanpub/article/PIIS2468-2667(18)30135-X/fulltext and
https://www.zoeharcombe.com/2018/08/low-carb-diets-could-shorten-life-really/
Ref 4: https://wwwn.cdc.gov/nchs/nhanes/search/DataPage
Ref 5: https://wwwn.cdc.gov/nchs/data/nhanes/1999-2000/questionnaires/spq-db.pdf
Ref 6: The approximate calories are calculated by multiplying the grams for carbs and protein by 4 and by multiplying the fat grams by 9. These were all reported in Table 1 – I only needed to total the number of calories for each column.
Ref 7: https://www.zoeharcombe.com/2018/01/saturated-fat/
Ref 8: O’Neil et al. Food sources of energy and nutrients among adults in the US: NHANES 2003e2006. Nutrients 2012 https://www.mdpi.com/2072-6643/4/12/2097
Ref 9: Harcombe et al. Evidence from prospective cohort studies does not support current dietary fat guidelines: A systematic review and meta-analysis. Br J Sports Med 2016.
Ref 10: Virtanen et al. Dietary Fatty Acids and Risk of Coronary Heart Disease in Men. Arteriosclerosis, Thrombosis, and Vascular Biology. 2014. https://www.ahajournals.org/doi/epub/10.1161/ATVBAHA.114.304082