
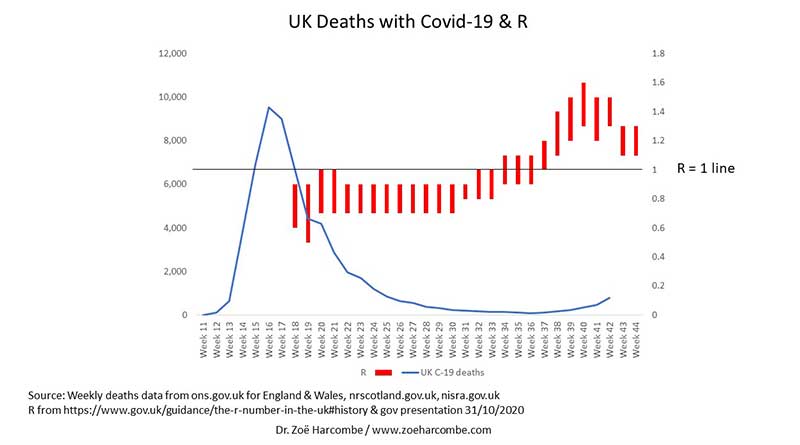
UK Deaths with Covid-19 & R
On Saturday 31st October, the UK truly had a Halloween fright when it was announced that England would be put back into lockdown from 5th November (the rest of the UK is in various states of lockdown already).
The Reproduction number, R, is a key estimate driving such decisions. R is the average number of people infected by one infected person (estimate remember). If R is greater than 1 the epidemic is growing, if R is less than 1 the epidemic is shrinking.
If R is so important, it makes sense to examine how closely it is associated with deaths.
In the image below, I have taken deaths with Covid-19 for England & Wales (Ref 1), Scotland (Ref 2) and Northern Ireland (Ref 3) and added them together for UK deaths.
This government site states that the R number was first reported on 15th May 2020 (Ref 4). The site reports subsequent R estimates. I obtained a couple of estimates of R earlier than 15th May from the slides presented by Whitty and Valance – the leaders of SAGE – from the 31st October national briefing (Ref 5).
I have plotted on the same graph:
1) Deaths for the UK with Covid-19 from week 11 until week 42 – the most recent data for the whole of the UK. This is plotted on the left hand Y axis.
2) The R estimate when known during this period. R is presented as an estimated range with a high point and a low point, so the red lines show the estimated range. This is plotted on the right hand Y axis and I have added a black line to show the R = 1 point. R is currently falling and I will update this as more data become available.
I’ll leave it to you to see if you think there’s a strong relationship between the R estimate and UK deaths with Covid-19.

References
Ref 1: https://www.ons.gov.uk/peoplepopulationandcommunity/birthsdeathsandmarriages/deaths/bulletins/deathsregisteredweeklyinenglandandwalesprovisional/weekending16october2020
Ref 2: https://www.nrscotland.gov.uk/covid19stats
Ref 3: https://www.nisra.gov.uk/publications/weekly-deaths
Ref 4: https://www.gov.uk/guidance/the-r-number-in-the-uk#history
Ref 5: https://assets.publishing.service.gov.uk/government/uploads/system/uploads/attachment_data/file/931775/Slides_to_accompany_coronavirus_press_conference-_CSA-__31_October_2020.pdf


Hi Zoe,
Love your work and really brilliant book ‘Obesity’. I would love your view on the vaccination, I am 66 and will not have the vaccination , but my son lives in Australia (moved last Oct), I am praying things change but as it is they try to blackmail people into the vaccination, for example can’t fly! Have you had the vaccination, and if not, how will you manage?
My other big concern and it has just been on the news Again, is that meat and dairy are bad for us and all need to cut back. How do we get our view across, that cattle are carbon neutral and an essential part of the environment and our health.
I just feel that sometimes I am a very small fish in a great big pond!!!
Thanks Zoe
Julie xx
Would be interested on your thoughts on why peak case rates per 100,000 do not follow lockdown dates – some areas had peaked before lockdown in Wales (eg Anglesey) despite no local lockdown, other such as Ceredigion and Pembrokeshire have continued rising even three weeks after lockdown started when they claimed we would start to see the impact. It can’t be said that Anglesey was protected by neighbouring lockdowns – it was busy with tourists from outside Wales before lockdown. There’s a range of patterns in between by the look of the published graphs but these are complicated by local lockdowns in many areas of Wales.
It was the same in the spring – North wales showed a lag of around 3 weeks post lockdown compared to South Wales. If lockdowns are effective, why was there a three week difference?
Hi Neil
This is an easy one in my view. It’s because lockdowns have no impact. Virus trajectories (deaths) follow the Gompertz curve. They demonstrate a sharp rise to the peak and then a long fall away tail. They do this in every country. Back in May/June and then again in Sept I invited people to mark on the curve where measures had been introduced and relaxed and of course no one can, because nothing makes any difference (https://twitter.com/zoeharcombe/status/1305056517557809152)
As this post also showed (https://www.zoeharcombe.com/2020/11/the-impact-of-lockdowns/) lockdowns have never been used before, there was no evidence for them and there still isn’t.
You are right to ask this question – if only every one did, this thing would be over!
Best wishes – Zoe
p.s. this is interesting on the topic too https://www.aier.org/article/even-a-military-enforced-quarantine-cant-stop-the-virus-study-reveals/
Your independent analysis and studies shed much needed light.
Well done and thank-you.
To most of us it is glaringly obvious and I doubt Whitty and Valance are that stupid that they cannot see it. I am not into conspiracy theories, but there has to be something else going on behind the scenes that we don’t know about. I remember back in March the government were talking of herd immunity and then a sudden change of plan as we copied China and it was never to be spoken of again.
I put a video up on youtube last week called the millennium bug, the curve and pattern was almost identical to this year, hospital beds full, surgeries cancelled but we never needed a lockdown.
Hi Chris
I’ll take a look at that – many thanks.
Doom and gloom they should be called!
Best wishes – Zoe
Zoe, don’t you think that this is explained by the fact that deaths will lag behind R? R measures how fast the disease is spreading – if R is high, then almost inevitably higher numbers of deaths will follow some weeks later (unless perhaps the transmission is contained to only low-risk groups).
The only issue here Zoe is that the ONS uses data from death certificates and therefore is very delayed in the reporting of deaths.
I’d be curious to see this re-run in a month’s time.
Hi Rebecca
I suspect there might be more issues than that! Flu having ‘disappeared’ is a counter issue and there will be more…
Best wishes – Zoe