
The Impact of Lockdowns

Executive summary
* A paper was published in the Lancet on October 22nd, 2020. It claimed to be the first study to quantify the effects of introducing and lifting (lockdown) measures on the rate of transmission of SARS-CoV-2 (“R”).
* Eight measures were assessed. They were collectively referred to as Non-Pharmaceutical Interventions (NPIs). These were i) closure of schools, ii) closure of workplaces, iii) public events bans (e.g., sports, festive, and religious events), iv) restrictions on the size of gatherings, v) closure of public transport, vi) stay at home orders, vii) restrictions on internal movement, and viii) restrictions on international travel.
* The study examined 790 phases from 131 countries from Afghanistan to Zimbabwe. A phase was defined as a time period when all measures remained the same.
* The study found that only 1 measure made a statistically significant difference at 28 days. Relaxing the ban on gatherings of more than 10 people increased “R” at 28 days (but not at 7 or 14 days). One measure alone (relaxation of school closures) made a statistically significant difference at 14 days (but not at 7 or 28 days). Six measures had a statistically significant impact at 7 days, but none of these impacts were sustained at 14 or 28 days.
* There were limitations of the research and these were fully covered in the paper. However, these non-findings are interesting and important, especially since lockdown measures are being re-introduced widely without supporting evidence.
* The paper did not set out to balance any possible benefits (in reduced viral transmission, please note – not in events or deaths) with any possible harms of NPIs. No medical intervention – pharmaceutical or non-pharmaceutical – should be undertaken without a harm-benefit analysis. This has still not been done.
Introduction
A paper was published in The Lancet on October 22nd, 2020, called “The temporal association of introducing and lifting non-pharmaceutical interventions with the time-varying reproduction number (R) of SARS-CoV-2: a modelling study across 131 countries” (Ref 1). That’s the academic way of saying “The impact of different lockdown measures in 131 countries.”
This was a timely study, as England is due to join the rest of the UK in lockdown from 5th November and measures are being re-introduced in a number of other countries. The UK has a particular knack for inventing words to avoid calling lockdowns “lockdowns”. We have Levels 0-4 in Scotland, Tiers 1-3 currently in England, a ‘partial’ lockdown in Northern Ireland and a complete lockdown in Wales, but it’s called a Firebreak. The UK Prime Minister, Boris Johnson, has said of the latest measures “We are not going back to the full-scale lockdown of March and April… But from Thursday the basic message is the same: ‘Stay at home. Protect the NHS. And save lives’.” While other countries are variously locking down and opening up, this study looked at what it called non-pharmaceutical interventions (NPIs) to understand the impact of introducing and lifting different restrictions.
This was a two part modelling study. While we have often said that models are only as good as their assumptions – and this is true – the first part of this study modelled things that had happened and the second part was then an “ad hoc analysis”, which tried to estimate what would have the greatest effect given the findings from part 1. Part 1, if not Part 2, could be of significant value because it modelled historical events rather than predicting future events based on assumptions.
The study
The aim of the study was to understand the association between introducing and lifting NPIs with the level of transmission of SARS-CoV-2, as measured by the “R” number, across 131 countries (from Afghanistan to Zimbabwe). You’ve probably heard R mentioned a lot over the past few months. R stands for the Reproduction number. It is the average number of people infected by one infected person. If R is greater than 1 the epidemic is growing, if R is less than 1 the epidemic is shrinking.
R itself is an estimate. It is estimated by several modelling groups based in universities and Public Health England (PHE). The modelling groups discuss their individual R estimates at the Science Pandemic Influenza Modelling group (SPI-M) – a subgroup of SAGE (The Scientific Advisory Group for Emergencies) (Ref 2). This Lancet paper used the estimates of R from the London School of Hygiene & Tropical Medicine. To be fair, the paper noted the limitations of the methodology for the R estimate used in their analysis – not least that the country R estimate was used, and the actual R rate would vary widely throughout a country.
Notwithstanding the limitations of estimating R, the study linked data on daily country-level estimates of R with data on country-specific policies for different phases of NPIs. A phase was defined as a time period when all NPIs remained the same. The timeline for each country between January 1 and July 20th, 2020 was divided into individual phases on the basis of what was happening with NPIs. The team calculated something called “the R ratio” for the study. The R ratio was defined as the ratio between the daily R of each phase and the R from the last day of the previous phase (i.e., the R after the measure was introduced divided by the R just before it was introduced). An R ratio of less than 1 would indicate a decrease in transmission. An R ratio of greater than 1 would indicate an increase in transmission. We would expect the R ratio to fall following introduced measures and to rise after relaxation of measures.
The study included 790 phases from 131 countries. The research team searched academic databases for studies, published from January 1st to August 5th, 2020, which reported the effects of introducing and lifting non-pharmaceutical interventions (NPIs) on R. The team reported that, to the best of their knowledge, this was the first study to try to quantify the impact of NPIs on R (Ref 3).
The researchers modelled the change in R values (as the R ratio) from day 1 to day 28 following the introduction and relaxation of 8 NPIs. These eight NPIs are the ones tracked by the Oxford COVID-19 Government Response Tracker (OxCGRT). They are:
i) closure of schools,
ii) closure of workplaces,
iii) public events bans (e.g., sports, festive, and religious events),
iv) restrictions on the size of gatherings (10 people was the limit assessed in this study),
v) closure of public transport,
vi) stay at home orders,
vii) restrictions on internal movement, and
viii) restrictions on international travel.
The researchers did sensitivity analyses (which all models should have). These are tests to see how sensitive findings are to the assumptions and the factors examined. Sensitivity tests in this study included comparing a ban on gatherings of more than 10 people with a ban on gatherings of more than 100 people to understand how different sized gatherings could impact R. The researchers examined individual phases alone by only including phases where just one NPI was changed. They excluded larger countries that could have greater regional variability in policies. One of the findings from sensitivity analysis was very interesting “Notably, we did not observe a substantial difference in our results when including in a sensitivity analysis only phases with comprehensive contact tracing in place. This was not as expected since contact tracing was believed to reduce transmission through early identification of infectious cases.”
Findings
There were a number of interesting findings that were reported – I’ll go through whether they should have been reported as they were:
1) Timing and types of measures.
The average (median) duration of phases was 11 days. Requirements to stay at home and restrictions on internal movements were the most common NPIs introduced, and were most often introduced and lifted simultaneously. Regarding the order of events, closure of schools and public events bans were the first two NPIs most commonly introduced and were lifted later than most NPIs. Requirements to stay at home and closure of public transport were the last two NPIs most commonly introduced and were lifted earlier than most NPIs.
2) Introducing NPIs.
The paper reported that the R ratio tended to decrease over time following the introduction of (i) school closure, (ii) workplace closure, (iii) public events ban, (vi) requirements to stay at home, and (vii) internal movement limits. The paper claimed that the reduction in the R ratio was only significant for (iii) the public events ban. “Over time” meant for the 28 day period reviewed.
a) this means that there were no reductions in the R ratio claimed or found following (iv) banning gatherings of more than 10 people, or (v) public transport closure, or (viii) international travel restrictions. The paper added “We did not observe a substantial reduction in transmission after introduction of bans on gatherings of more than ten or more than 100 people, especially for more than 100 people, which showed an increase in transmission after day 14.” i.e. restricting numbers to 10 didn’t help and restricting them to 100 worsened transmission! The paper suggested “possible explanations for this finding include low adherence and, for the ban on gatherings of more than 100 people, an increase in smaller-scale gatherings.”
b) the paper should not have reported any decreases in the R ratio unless significant, so there should have been no implied findings from the introduction of (i) school closure, (ii) workplace closure, (vi) requirements to stay at home, and (vii) internal movement limits because these were not statistically significant.
c) the paper should also not have tried to claim that the reduction in the R ratio was significant for (iii) the public events ban, as the 95% confidence interval included 1.0 and so this was not statistically significant either.
3) Relaxing NPIs.
The paper reported that the R ratio tended to increase over time following the relaxation of (i) school closure, (iii) bans on public events, (iv) bans on public gatherings of more than 10 people, (vi) requirements to stay at home, and (vii) internal movement limits. The paper claimed that the increase in the R ratio was only significant for (i) school reopening and (iv) lifting bans on public gatherings of more than 10 people.
a) this means that there were no increases in the R ratio claimed or found following relaxations in (ii) closure of workplaces, (v) closure of public transport and (viii) restrictions on international travel.
b) the paper should not have reported any increases in the R ratio unless significant, so there should have been no implied findings from the relaxation of (iii) bans on public events, (vi) requirements to stay at home, and (vii) internal movement limits because these were not statistically significant.
c) the paper should also not have tried to claim that the increase in the R ratio was significant for (i) school reopening, as the 95% confidence interval included 1.0 and so this was not statistically significant.
d) The one true finding, therefore, was that lifting bans on public gatherings of more than 10 people was statistically significant (although it wasn’t significant at 14 or 28 days when introduced and the relaxation wasn’t significant at 7 or 14 days.)
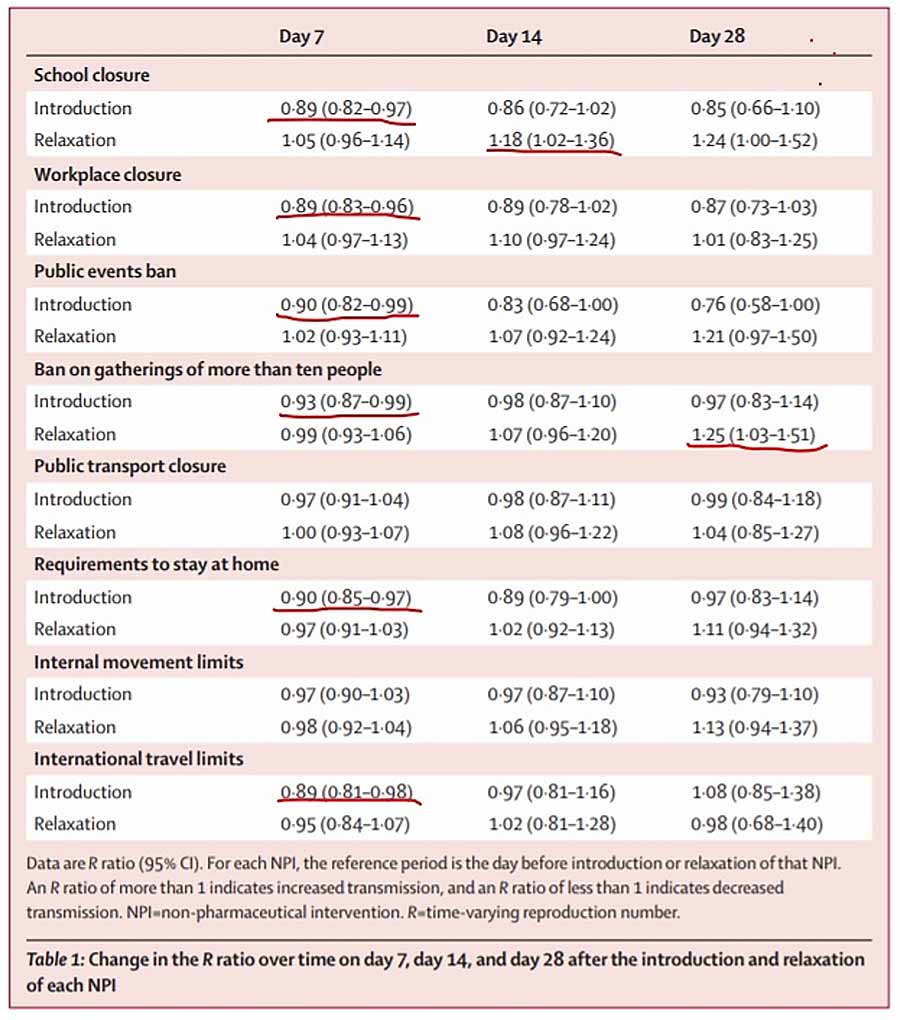
Table 1
The key table in the paper is Table 1 – reproduced below. I have underlined in red the only statistically significant findings. The paper should have reported these findings as follows:
– One NPI alone had a statistically significant impact at 28 days (but not at 7 or 14 days). The R ratio rose when restrictions on gatherings of more than 10 people were relaxed.
– One NPI alone had a statistically significant impact at 14 days (but not at 7 or 28 days). This was the relaxation of school closures. This increased the R ratio by 18%.
– Six (introduced) NPI measures had a statistically significant impact at 7 days, but none of these impacts were sustained at 14 or 28 days. These six were (i) closure of schools, (ii) closure of workplaces, (iii) public events bans, (iv) restrictions on the size of gatherings (no more than 10 people), (vi) stay at home orders, and (viii) restrictions on international travel. The (v) closure of public transport, and (vii) restrictions on internal movement made no statistically significant difference whether at 7, 14 or 28 days.
Limitations of the paper
Further to the limitation on the accuracy of R already noted, the paper also noted a number of other limitations:
1) The paper was based on policies introduced rather than population behaviour. Adherence to measures was not known or examined.
2) Some NPIs were introduced before others and hence it was difficult to isolate the impact of one measure.
3) Just as a significant limitation with R was that national data was used, so a significant limitation of measures were that they were introduced at national levels. A public transport ban in Paris, for example, could have a very different impact to a public transport ban in the Loire valley and yet country averages were examined.
4) Other measures (beyond the eight) may have had impacts e.g. hand washing, different distancing practices being adopted and so on. (However, these other measures should have helped to reduce R making it more surprising that little of significance was found from the eight major measures).
Closing thoughts
A number of measures have been introduced in countries across the world to try to prevent the transmission of a virus. There was no evidence as to the efficacy of these measures before they were introduced. Searching pubmed for “lockdown” before Covid-19 elicited papers such as “Distress and rumor exposure on social media during a campus lockdown” (Ref 4). This paper was about university lockdowns during active-shooter events.
This Lancet paper reported “To the best of our knowledge, this study is the first to explicitly quantify the effects of both introducing and lifting individual NPIs on R over time.” I have no reason to doubt this. This first paper found support against one measure (relaxing bans on gatherings of more than 10 people) at 28 days (but not at 7 or 14 days), support against one measure (relaxing school closure) at 14 days (but not at 7 or 28 days) and support for introducing 6 measures at 7 days, but not beyond this.
The paper did not set out to assess possible benefits with possible harms of NPIs. Please also note that the R number/ratio is a surrogate end point rather than a health benefit per se. The harms of the eight NPIs examined are substantial – from children’s education and mental health… to suicide, loneliness and people with dementia feeling unloved and abandoned… to destruction of family businesses and livelihoods… to national and individual debt and poverty. The “stay at home” instruction alone has been forecasted to have tens of thousands of deaths ‘in the pipeline’ as a result of cancer, heart disease, diabetes and other non-communicable illness not having been treated during lockdowns. No medical intervention – pharmaceutical or non-pharmaceutical – should be undertaken without a harm-benefit analysis. This has still not been done.
I have been going through the SAGE minutes for another piece of research and found something interesting from the 16th meeting of SAGE, which was held on 16th March. The following statement was in the minutes: “The risk of one person within a household passing the infection to others within the household is estimated to increase during household isolation, from 50% to 70%.”
This means that we knew back in mid-March that locking people in their homes would increase the risk of virus transmission. My note on social distancing on June 8th confirmed this (Ref 5). The greatest likelihood of virus transmission was among closest family members in the home – people sharing a room with and/or people caring for someone else. Might we have – with the ultimate irony – done more harm than good with the very place we have confined people to? Have we wrongly assumed that home is the safest place to be?

References
Ref 1: https://www.thelancet.com/journals/laninf/article/PIIS1473-3099(20)30785-4/fulltext
Ref 2: https://www.gov.uk/guidance/the-r-number-in-the-uk#about-r-number-and-growth-rate
Ref 3: The Lancet paper did reference another study (Flaxman et al) that examined the impact of NPIs in 11 European countries and said that findings were “broadly similar”, but that Flaxman et al had not assessed changes over time.
Flaxman S, Mishra S, Gandy A, et al. Estimating the effects of non-pharmaceutical interventions on COVID-19 in Europe. Nature 2020.
Ref 4: https://pubmed.ncbi.nlm.nih.gov/29042513/
Ref 5: https://www.zoeharcombe.com/2020/06/social-distancing-the-evidence/


Can R be measured – even approximately – in the real world (i.e. outside a model)?
I must admit that I don’t see how. But then I don’t see how the conclusions of an abstract mathematical model can ever be sufficiently robust to justify stringent restrictions on millions of people.