
Who lives to 100?

Executive summary
* This week’s study is from Sweden. It aimed to see if any biomarkers (blood test measures) were different in people who lived to 100 (centenarians) vs those who died before this birthday.
* It followed 45,000 Swedish people for up to 35 years. It measured 12 biomarkers (measures of metabolic, kidney and liver health etc).
* It found that 10 out of 12 markers were different in those who lived to 100.
* The markers were largely consistent for men and women, and they showed up when people were aged 64-74. Hence the markers enabled a prediction from years earlier of who would be more likely to reach 100.
* Those who reached 100 had higher total cholesterol, lower glucose, lower creatinine (a kidney marker), much lower uric acid, lower liver markers, and better iron markers.
* The paper did not explore what interventions people could make to improve these markers. (Apart from noting that a number of markers of alcohol intake were lower in centenarians.)
* Living to 100 does not mean being healthy at 100. The authors cited other literature that reviewed how few centenarians enjoy good health. Reaching 100 may not be our best health goal, therefore.
Introduction
Many thanks to CG-Aller from Sweden for this week’s study, which is also from Sweden. The paper we’re looking at is called “Blood biomarker profiles and exceptional longevity: comparison of centenarians and non‑centenarians in a 35‑year follow‑up of the Swedish AMORIS cohort.” It was written by Murata et al (Ref 1).
The study aim was brilliantly simple. It followed almost 45,000 Swedish citizens, aged 64 to 99, for up to 35 years. It was interested in those who reached the age of 100 (centenarians) compared with those who didn’t. It assessed a number of biomarkers to see if there were any that were different in the centenarians vs the non-centenarians.
The introduction to the study narrated that the global number of centenarians has approximately doubled every decade since 1950 and is projected to quintuple between 2022 and 2050 (Ref 2). Yet, we know little about why some people reach 100 and others don’t. This study set out to see if any biomarkers could help our understanding of super longevity.
The introduction referenced previous studies in this field. An Italian study of 602 centenarians found that only 20% were in good health, while 33% had intermediate health and 47% were in poor health (Ref 3). A Danish study found similarly that there were robust, intermediate and frail centenarians (Ref 4). A German study placed 1,121 centenarians into 4 groups and found only a small proportion were in good health (Ref 5). Hence living to 100 doesn’t necessarily mean robust health. However, let’s see if there are any markers associated with reaching this landmark birthday.
The study
The paper used data from the AMORIS (Apolipoprotein MOrtality RISk) population study. This study comprised individuals who underwent clinical lab testing at the Central Automation Laboratories, either as part of routine general health checkups or as outpatients referred for laboratory testing, between 1985 and 1996 in Stockholm County. This amounted to more than 800,000 individuals.
This particular paper took a subgroup of these 800,000 individuals. People born between 1893 and 1920 were included, which enabled follow-up of all participants until the age of 100. Individuals were aged between 64 to 99 at the time of their blood tests. People who emigrated during the follow-up were excluded (247 people.) The final population for this paper numbered 44,636 people. Of these, 5,851 participants (13.1%) died before their 80th birthday, 21,234 (47.6%) died between their 80th and 90th birthdays, 16,327 (36.6%) died between their 90th and 100th birthdays, and 1,224 (2.7%) became centenarians.
The biomarkers
Twelve blood-based biomarkers related to inflammation and metabolic, liver, and kidney function as well as potential malnutrition and anaemia were included. These biomarkers have been associated with aging or mortality in previous studies.
These were captured in supplemental table 1 – replicated below.
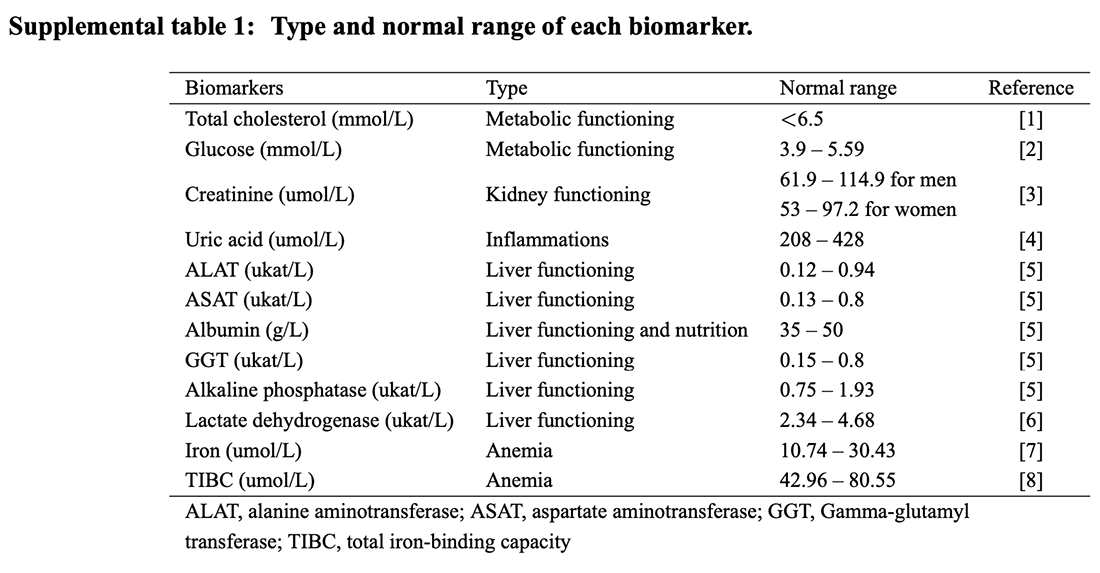
As the table reports, total cholesterol and glucose were chosen for metabolic status. Creatinine was the measure used for kidney functioning. Uric acid was the marker for inflammation. Uric acid is produced when the body breaks down purines – natural substances found in every cell and in most foods.
Six markers were chosen for liver function: alanine aminotransferase (ALAT); aspartate aminotransferase (ASAT); albumin; gamma-glutamyl transferase (GGT); alkaline phosphatase (ALP); and lactate dehydrogenase (LD). ASAT can also be a marker of muscle damage. GGT can also be a marker of bone damage. LD can be a marker for many concerns – we’ll come back to this. Albumin was also considered a marker for nutrition. Albumin is a protein made by the liver. It is the most abundant circulating protein found in plasma. Low albumin levels can be a sign of liver or kidney disease or another medical condition. High levels may be a sign of dehydration.
Iron and total iron-binding capacity (TIBC) were used for anaemia. A total iron-binding capacity (TIBC) test measures the blood’s ability to attach itself to iron and transport it around the body. If you have iron deficiency (anaemia), your iron level will be low, but your TIBC will be high.
The first critique of the paper should be – were these the best biomarkers to use? Their references 8, 17, 18 and 19 cited studies where these biomarkers had been shown to be associated with longevity. I would have thought that an insulin marker would have been important and vitamin D levels and perhaps telomeres. A couple of the liver function markers could have been sacrificed if 12 tests were deemed ideal.
The results
At the top level, there was a sex difference, as we would expect. Women comprised 85% of the centenarians and 61% of the non-centenarians. Women are more likely than men to live to 100.
The results presented the average levels of each biomarker for those who reached 100 vs those who didn’t. The results were cut in a number of different ways in the paper and the supplementary material. People were grouped by sex and by age of recruitment into the study to see if markers were more or less relevant for people of different sex and age. For example, albumin might be a useful marker for women in their 80s, but not for men in their 60s.
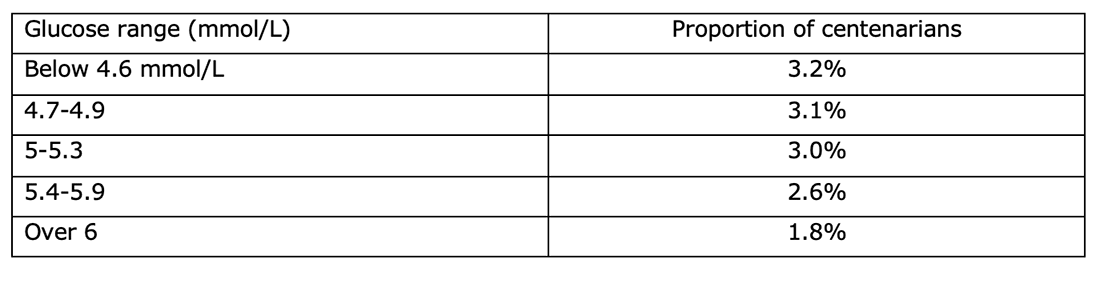
The biomarkers were also reviewed in quintiles – not just the average. This tells us whether increments are important. The glucose measurement provided a good example of the value of the quintile analysis. Glucose was reviewed in quintiles – below 4.6 mmol/L, 4.7-4.9, 5-5.3, 5.4-5.9 and over 6 mmol/L. The proportion of people who reached 100 went down as each glucose quintile went up.
This tells us that glucose is an important marker – both in terms of average comparisons and also progressive comparisons. The higher glucose goes, the lower the likelihood of reaching 100.
Supplemental table 2 provided the best summary of what was an important marker and what wasn’t. I’ve replicated this below.
Inevitably in a study of this size, there were missing values for some people. The “missing” column in Supplemental table 2 shows that ‘only’ 7% of creatinine results were missing but over one third of lactate dehydrogenase (LD) results were missing. In Supplemental table 2, the “complete case sample” columns are for all recorded values. The “imputed sample” columns include estimated values for those missing. This is a valid exercise. If participants are excluded for missing data, this could bias the results.
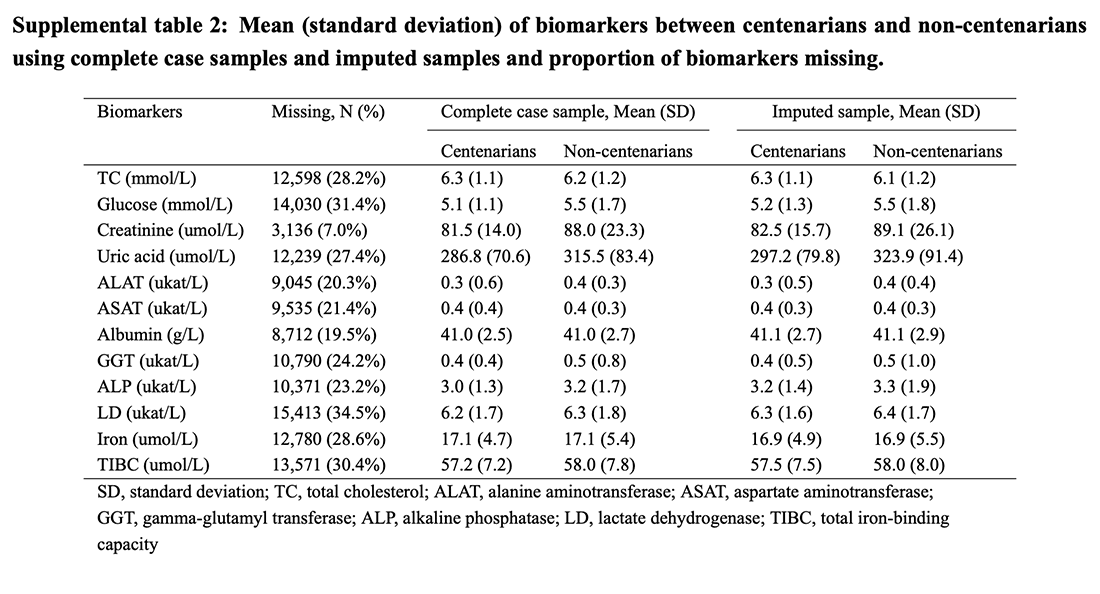
The ”imputed sample” columns in Supplemental table 2 are the ones to look at. We can see differences in the markers for centenarians vs non-centenarians. Those who reached 100 had (wait for it) higher total cholesterol, lower glucose, lower creatinine, much lower uric acid, lower liver markers, and better iron markers (lower TIBC predominantly).
The author conclusion was “We found that all included biomarkers except for ALAT and albumin were predictive for the likelihood of reaching age 100.”
Supplemental table 2 was not the only table to generate that author conclusion. There were many figures in the main paper, which reviewed men and women separately and different age groups separately. Iron, for example, was the same, on average, overall in Supplemental table 2. However, iron was consistently higher among men and women of different ages between centenarians and non-centenarians.
Men and women were reviewed separately in three age groups (64-74, 75-84, 85-99). This enabled us to see that the markers were largely consistent in men and women and across the ages. Total cholesterol, for example, was higher in the centenarians in men and women in all three different age groups. There were exceptions, for example, ASAT was higher in men aged 85-99 who went on to reach 100. In all other groups, ASAT was lower (even just fractionally) in those who reached 100. This consistency across the age groups means that we would be able to predict from these biomarkers in 64 to 74 year olds, (and 75 to 84 year olds and 85 to 99 year olds) who is more likely to live to 100.
There were two markers where participants were, on average, outside the normal range. For alkaline phosphatase (ALP) and lactate dehydrogenase (LD), both centenarians and non-centenarians were well outside normal ranges. This held for men and women and across the three age groups reviewed. This suggests that maybe the ranges that are deemed normal are incorrect.
Another interesting finding was that “A dose-response relationship was found for uric acid; individuals within the lowest quintile had almost twice the chance of reaching age 100 compared to those in the highest quintile.”
What can we do about this?
The researchers opened the discussion section by saying “Our work is to date the largest study comparing biomarker profiles measured at similar ages earlier in life among exceptionally long-lived individuals and their shorter-lived peers.” It has provided original and useful information in so doing. However, people might want to know – how can I live to 100?
Back to the markers, some have more obvious ‘calls to action’ than others. Lower glucose levels were consistently shown to be better if your goal is to reach 100. Would-be centenarians should avoid having raised blood glucose levels. That suggests a low carbohydrate diet to me.
Total cholesterol levels were higher in the centenarians. We can’t eat to raise cholesterol, but we can avoid reducing it. That would imply avoiding cholesterol lowering medications and substances (plant sterol margarines etc).
Uric acid is associated with alcohol and fructose intake. Fructose intake is also a carbohydrate intake marker. The paper noted that several alcohol-related biomarkers (especially GGT and ASAT) were higher in non-centenarians (and lower in centenarians). Both alcohol and fructose are implicated in ASAT and ALAT. The authors suggested that more research may be needed to establish the impact of alcohol on super longevity.
For other markers, the call to action is less obvious. Lactate dehydrogensae (LD), for example, is a marker of many issues. It can indicate liver disease, anaemia, heart attack, bone fractures, muscle trauma, cancers, and infections such as encephalitis, meningitis, encephalitis, and HIV. This paper has confirmed that higher LD is not good if you want to reach 100. However, what should one do to lower this marker? Avoiding heart attacks, cancer and infections is something we would all like to do, but the ‘how-to’ manual is not clear.
There were some interesting nutrition markers in this research. GGT can be impacted by vitamin D deficiency. Fructose has been implicated in markers. Glucose is best controlled. Iron is important. These markers combine to support a nutrient dense diet – rich in micronutrients and not too high in foods that convert to glucose (carbohydrates).
My usual advice – 1) eat real food, 2) choose that food for the nutrients it contains (meat, fish, eggs, dairy, and green things as the base) and 3) eat a maximum of three times a day – still holds after reading this research.
There is also the issue of health to consider. We recently returned from Greece and got chatting to a retired farmer couple at the airport. The wife shared that her mother had died while they were away. We expressed our condolences, but these were waved away. The couple explained that mum was 101 and had long ago lost her beloved husband and all friends. She was blind, deaf and had been without mobility and cognition for years. The family had been upset by mum’s condition for some time and now felt relief that her suffering was over.
Do we really want to live to 100 or do we want the maximum number of healthy and active years that we can enjoy? My goal is the latter.
References
Ref 1: Murata et al. Blood biomarker profiles and exceptional longevity: comparison of centenarians and non‑centenarians in a 35‑year follow‑up of the Swedish AMORIS cohort. GeroScience. 2023.
https://link.springer.com/article/10.1007/s11357-023-00936-w
Ref 2: United nations, department of economic and social affairs, population division. World population prospects 2022, Online Edition. 2022. https://population.un.org/wpp/
Willcox et al. Centenarian studies: important contributors to our understanding of the aging process and longevity. Curr Gerontol Geriatr Res. 2010.
Ref 3: Motta et al. Successful aging in centenarians: myths and reality. Arch Gerontol Geriatr. 2005.
Ref 4: Alvarez et al. Stratification in health and survival after age 100: evidence from Danish centenarians. BMC Geriatr. 2021.
Ref 5: Gellert et al. Multimorbidity profiles in German centenarians: a latent class analysis of health insurance data. J Aging Health. 2019.


Regarding your last comment “Do we really want to live to 100 or do we want the maximum number of healthy and active years that we can enjoy? My goal is the latter.” Most studies show that the years of decrepitude at the end of life is fairly constant at around 2 years irrespective of our age of death. So if we live to 100, we have 98 healthy and active years that we can enjoy and 2 years of poor health. Living longer generally increases our chances of having more healthy and active years that we can enjoy.
Hi Ron
Many thanks for this interesting addition to the debate. I’ll have 98 good years then please! ;-)
Best wishes – Zoe
Fascinating article Zoe, thanks.
It is important to be as critical of articles that favour our ideas as of articles that criticise our ideas. The differences in total cholesterol for centenarians compared with non-centenarians are small – 6.3 compared to 6.1, as they are in glucose – 5.5 compared to 5.2. Are these differences significant?
Hi Ron
Many thanks for this.
Figure 2 in the main paper is the one that gets close to showing statistical significance. Bizarrely the middle group (of 5) was taken as the reference rather than the top or bottom. This reduced the number of results that achieved significance.
The highest glucose category still achieved significance vs the middle category, which was quite an achievement. The lowest TC category touched the line of no effect vs the middle group. If the lowest TC had been compared with the highest it would have achieved statistical significance.
So yes, I think they were. Plus, as the narrative is constantly lower cholesterol is better, it’s interesting to point out counters to this narrative when they occur (which is quite often!)
Best wishes – Zoe