
COVID-19 – deaths & excess deaths
Executive Summary
* This week’s note looks at deaths during spring 2020 for Australia, the US, and the UK. It presents the most recent data for deaths with COVID-19, a few weeks on from the peak in deaths that occurred for all three countries in April 2020.
* Excess mortality – the number of people dying above normal – is a key measure to consider with a novel virus. This note presents calculations and estimations of excess deaths during this period, noting that approximately 20-30% of excess deaths are reported as not related to COVID-19. The reasons for these deaths are not understood as yet.
* Death rates are presented in the context of normal death rates, typical average daily death rates and within the context of other periods of excess mortality.
* Australia has had so few deaths with COVID-19 that the virus won’t be discernible among normal death rates. The US and UK graphs show a spike for spring 2020, but this is not dramatically different to previous periods of excess deaths from other viruses.
* Within the US and the UK, different regions have fared very differently. The reasons for this, just as the reasons that different countries have fared so differently, are not yet understood.
* There is much that we still don’t know – not least deaths that may occur in months to come from conditions that have been neglected during the past few months.
Introduction
I first wrote about COVID-19 on the 20th March (Ref 1). I didn’t know then that the UK would be put into lockdown on 23rd March and I didn’t expect that Wales would still be in pretty much full lockdown almost 100 days later. Now is a good time to take a first reflective look at the data, as the peaks have long since passed in the US, UK and Australia – which is where most readers of this note reside. The peak in Australia occurred in the first week of April. The UK peak was around April 8th. The US is a bit more complicated, because different states had peaks at different times, but one of the main virus data sites, worldometer, suggests that the US as a whole peaked around April 21st (Ref 2).
All of the following numbers are correct as of the time of writing this note (June 24th – June 29th). Please note that I’ve used worldometer data for COVID-19 death numbers to optimize consistency between the countries being reviewed. Worldometer records deaths by date reported. The date of death occurring can differ from the date of death reported for many reasons – weekends and holidays being one of the main ones. A death might happen on a Saturday and not get reported until Monday. This has the effect of making the bars on deaths charts look ‘a bit all over the place’. The curve drawn across the bars – to average out these artificial jumps – is the important line to look at.
Australia
In 2018, 158,493 deaths were recorded in Australia (Ref 3). That’s an average of 434 per day. On April 6th, the highest number of deaths with COVID-19 was reported. There were 8 deaths. Australia has had 104 deaths with COVID-19 recorded in total (Ref 4). Australia closed borders to all non-residents on March 20th and introduced social distancing and business closure measures on March 21st. Many restrictions will remain in place until at least July (Ref 5).
“Excess mortality” is an important measure when reviewing the impact of a virus. The world Health Organization defines this as “Mortality above what would be expected based on the non-crisis mortality rate in the population of interest” (Ref 6).
The simplest (back-of-the-envelope) way to look at excess mortality is to take peak deaths attributed to the virus compared to average daily deaths. If there are similar, or more, deaths on any day during a pandemic than would typically occur, it would be reasonable to expect excess mortality. In the Australian figures above, we would compare 8 (the highest daily deaths with COVID-19) with 434 (typical daily deaths) and conclude that there is unlikely to be excess mortality of any significance in Australia. We should note that deaths do not occur evenly throughout the year. There are more deaths in the winter due to respiratory diseases and there can be more during extreme heat or pollution in the summer.
Excess mortality is calculated more accurately by comparing deaths in one period with the average deaths in the same period over a few years previously. During the COVID-19 period, the UK has been reporting deaths each week as compared to average deaths in the same week over the past five years (Ref 7).
There’s no point in doing a graph of excess mortality in Australia because the deaths with COVID-19 have got nowhere near average deaths that would occur anyway. Since the date that Australia locked down until the date of this note, there will have been, on average, 43,857 deaths from all causes in Australia, with 104 of these with COVID-19.
The US
In 2017, there were 2,813,503 deaths recorded in the US (Ref 8). That’s an average of 7,708 per day. On April 21st, the highest number of deaths with COVID-19 was reported. There were 2,693 deaths. The US has had 123,476 deaths with COVID-19 recorded in total (Ref 2). Lockdown was undertaken on a state by state basis, so most did and five didn’t (Arkansas, North Dakota, South Dakota, Iowa and Nebraska). The degree and specifics of lockdown were determined by each state, as was the release of lockdown. Most states are open fully or partially although there are still different rules in place about things such as masks, travel, and gatherings. US state responses have varied greatly (Ref 9).
California was one of the first states to lock down, on March 19th. Since that date until the date of this note, there will have been, on average, 786,239 deaths in the US.
The CDC has helpfully done the excess deaths chart for us and it has rightly shown the trend over recent years to capture the most recent period of excess deaths unrelated to COVID-19 (Ref 10).
The graph shows the spike that was seen in many countries around Christmas/New Year December 2017/January 2018 with a particularly fatal flu virus. The graph also shows that there were excess deaths recorded in the US for the weeks ending 28th March until 6th June 2020. The trajectory looks as if it continuing to fall away from the peak in April.
Excess deaths have been dramatically different across states. The NY Times estimated that there have been 107,900 excess deaths during the period of spring 2020, where the graph above shows excess mortality (Ref 11). Approximately 80% of these excess deaths were attributed to COVID-19 leaving about 20% unexplained. This has been observed in other nations and needs examination in the near future. There have been excess deaths during this period not from COVID-19 and we need to understand why.
New York City was hardest hit, accounting for a quarter of all US excess deaths (26,200 out of the 107,900). New York City’s death rate was 217% of its normal death rate. The wider New York region accounted for a further 12,800 excess deaths and New Jersey accounted for 17,800. This means that this north east corner of the US accounted for 53% of the country’s deaths. Two states reported normal death rates (Arkansas and Idaho). Six reported below normal death rates (Hawaii, Kentucky, Maine, Montana, Oklahoma and south Dakota.) Of the states that didn’t lock down, the worst excess death rate was 4% higher than normal in Iowa and Nebraska, which represented 200 excess deaths in Iowa and 100 in Nebraska.
The UK
In 2019, 603,398 deaths were recorded in the UK (Ref 12). That’s an average of 1,653 per day. On April 10th, the highest number of deaths with COVID-19 was reported. There were 1,152 deaths. The UK has had 42,927 deaths with COVID-19 recorded in total (Ref 13). The UK locked down on March 23rd with the four nations of the UK following the same measures. The four nations have eased lockdown very differently, with England, Scotland, Wales, and Northern Ireland all doing their own thing. As a general rule, England has released lockdown the most and Wales the least.
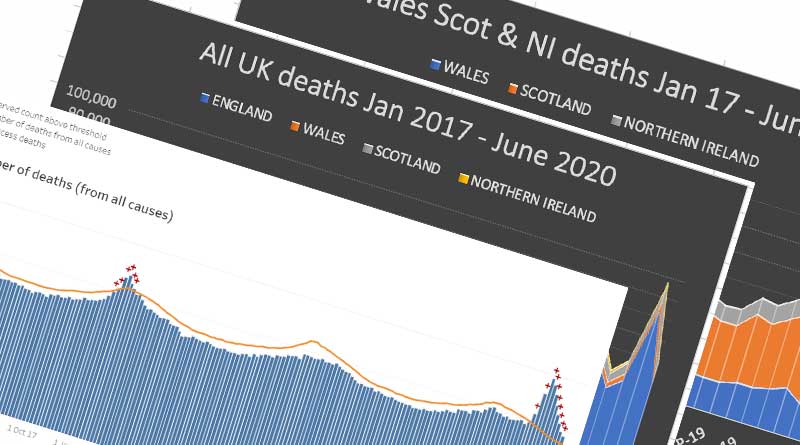
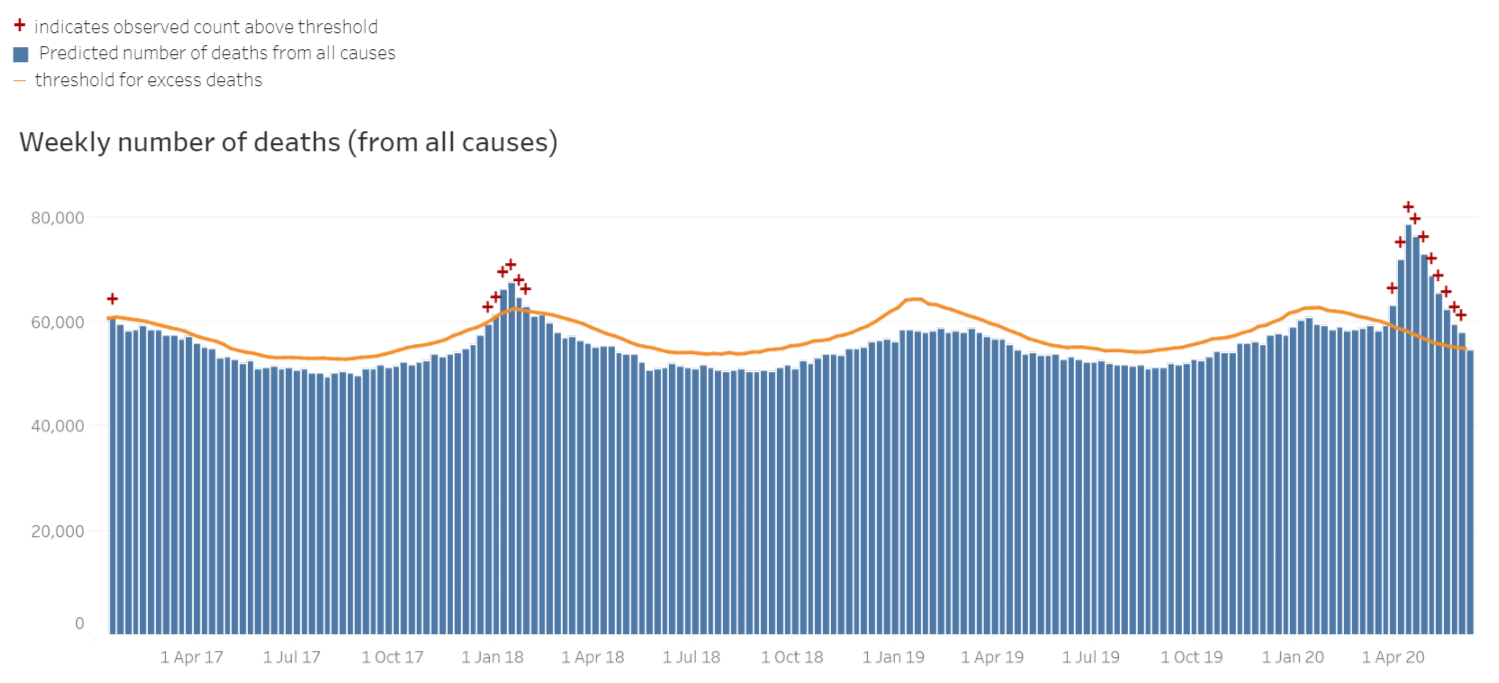
Pictures are definitely worth a thousand words for this subject area. Here is the graph for deaths each month since January 2017 for the four nations of the UK together and separately.

The UK deaths graph shows the same flu spike around December 2017/January 2018, as occurred in the US graph. The UK deaths graph also shows that the spike in mortality around COVID-19 has pretty much been confined to England and pretty much been confined to April 2020.
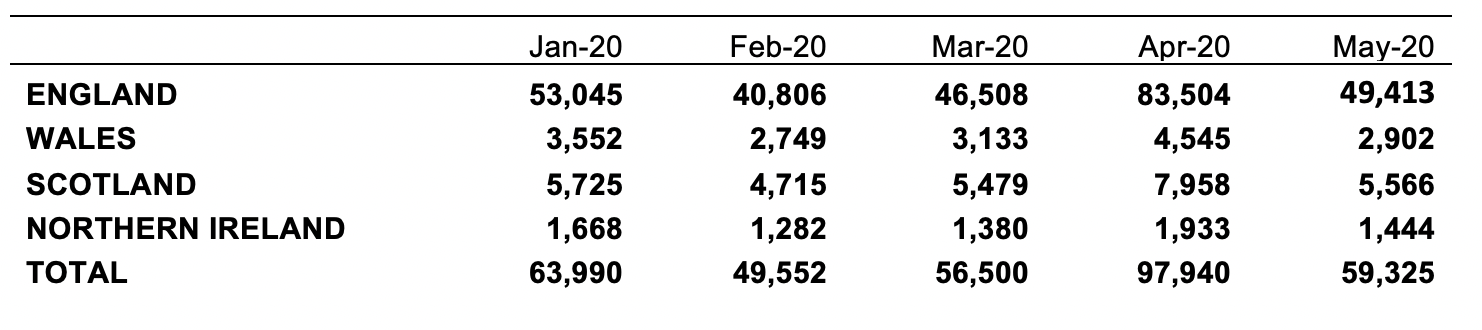
The numbers of deaths behind this chart are in the following table:
Below is the graph for Wales, Scotland and Northern Ireland, without England, which shows the relative normality of these regions more clearly:

There are three publications, from the Office for National Statistics (ONS), which help to better understand the England numbers. These three publications are for England and Wales, but Wales can almost be ignored, as the findings apply almost exclusively to England.
1) Total deaths (monthly report) (Ref 14)
The ONS has been publishing a monthly report with deaths for England and Wales, down to regions as small as Watford (England), the London borough of Westminster and Newport (Wales). The most recent report was published on June 26th, with the figures for May 2020, which is why I’ve only just been able to do this note.
The monthly report shows that, of the 83,504 deaths in England in April, 30% (25,000) were in London and the South East. Another 15% have been in the North West of England. I’ve seen a number of articles trying to explain why London and New York have been relatively hard hit by COVID-19 and explanations have included the fact that these two cities are at the centre of world travel and have thus been uniquely open to the rest of the world. Additionally, both cities are densely populated, with crowded public transport and areas of deprivation, the latter being known for disproportionate death rates. Manchester airport and the region’s population density may have contributed to the deaths rates in North West England. These are all hypotheses at this stage; we don’t know full facts by any means.
2) Excess deaths (weekly report) (Ref 7)
The ONS weekly report for England and Wales contains a line reporting the average deaths in the corresponding week over the past five years. This enables us to sum deaths per week and to compare this with the average of the previous five years to calculate excess mortality.
Taking the whole of 2020, up until the week ending June 12th (the most recent data available) there have been 317,288 deaths in England and Wales. On average, in the previous 5 years, there have been 262,858 deaths. We could say that excess deaths have averaged 54,430, therefore. Alternatively, we could say that the first deaths with COVID-19 were reported in the week ending March 13th and look at excess deaths only in the period since then, which would be 59,138.
It is important to note that excess deaths are not all attributable to COVID-19. Just as the US found that approximately 20% of excess deaths in this period were not due to the virus, the England and Wales data show the same. Taking the peak virus period – using weekly data, for the 6 weeks ending March 27th up to and including May 1st – there were 46,494 excess deaths in that period; 13,237 of them were not with COVID-19. That’s almost 30% of England and Wales excess deaths not explained by the virus. These could be viewed as deaths resulting from our response to the virus – lockdown. Specific reasons could include domestic violence murders; suicides; and deaths from cancer, heart disease and diabetes while resources were focused on COVID-19. There should also have been fewer deaths from other respiratory conditions with reduced air pollution and fewer deaths from road traffic accidents. This will be a complex period to look back on, therefore.
3) Excess deaths in context
The final ONS report worthy of note is one that has looked back on the periods of the greatest numbers of excess deaths, since the 1950s (Ref 15). This post was written in November 2015 as a reflection on the excess winter deaths of 2014/2015. There were 44,000 excess winter deaths (primarily from flu) over that winter. This was the highest since the previous peak of 48,000 excess deaths in the winter of the new millennium 1999/2000.
These two peaks were then put in context of the previous half century, which showed that there were 106,400 excess deaths in the winter of 1950/51 (chart below) (Ref 16). Given that the population was so much smaller then, the results are even more striking.

Reflection & expert opinion
This post has collated data on deaths for Australia, the US, and the UK. It has included typical annual deaths, average deaths per day, deaths with COVID-19 and a review of excess deaths during the COVID-19 period, with some additional data to show regions hardest hit and deaths during the lockdown period not attributed to the virus. It has tried to put these excess deaths in context with a comparison to the most recent ‘bad flu season’ – with additional history for England and Wales.
This post doesn’t get into debates about any of this. Would earlier lockdown have helped? Would no lockdown have helped? Would different measures have helped? The post has also only scratched the surface of why different regions may have had such different death rates, let alone countries.
There is much that we still don’t know – what will the legacy death rate from lockdown be? Especially for deaths from cancer. There are 165,000 cancer deaths in the UK alone each year. There are 367,000 new cases diagnosed each year (Ref 17). Professor Karol Sikora, an oncologist, spoke out even before lockdown (March 20th) concerned that cancer deaths may result from cancelled treatment and missed diagnoses (Ref 18). On April 22nd, in a report for ITV News, Sikora estimated that there could be as many as 60,000 cancer deaths as a result of the UK’s response to the virus (Ref 19).
Professor Michael Levitt, a Nobel laureate and Stanford biophysicist, started studying the COVID-19 numbers in January 2020. He was interviewed by Ivor Cummins in a video, which was posted on May 19th (Ref 20). Levitt said “I wrote this in an LA Times interview that I did at the end of March (Ref 21). I think that basically the risk having COVID is basically like doubling the natural rates of death for one month.”
Looking at the numbers with the benefit of some hindsight, Levitt’s prediction was impressive. It may have over-estimated excess deaths during the spring of 2020, and it didn’t discern between deaths with COVID-19 and as yet unexplained deaths during the same period. It looks as if England has experienced not far short of an extra month’s deaths during this spring, while the US has fared a bit better and Australia has hardly been scathed.
I’m curious to see what happens next and I’m hoping that Professor Sikora’s predictions are not as accurate as Professor Levitt’s, although I fear that they might be. Meanwhile, hopefully what we do now know is of interest.

References
Ref 1: https://www.zoeharcombe.com/2020/03/coronavirus-covid-19-some-facts-figures/
Ref 2: https://www.worldometers.info/coronavirus/country/us/
Ref 3: https://www.abs.gov.au/AUSSTATS/[email protected]/mf/3302.0
Ref 4: https://www.worldometers.info/coronavirus/country/australia
Ref 5: https://www.theguardian.com/australia-news/2020/jun/24/covid-19-restrictions-australia-coronavirus-lockdown-rules-update-how-far-can-travel-border-social-distancing-nsw-victoria-queensland-qld-wa-sa-act-how-many-people-over-house
Ref 6: https://www.who.int/hac/about/definitions/en/
Ref 7: https://www.ons.gov.uk/peoplepopulationandcommunity/birthsdeathsandmarriages/deaths/datasets/weeklyprovisionalfiguresondeathsregisteredinenglandandwales
Ref 8: https://www.cdc.gov/nchs/fastats/deaths.htm
Ref 9: https://www.businessinsider.com/us-map-stay-at-home-orders-lockdowns-2020-3?r=US&IR=T
Ref 10: https://www.cdc.gov/nchs/nvss/vsrr/covid19/excess_deaths.htm
Ref 11: https://www.nytimes.com/interactive/2020/05/05/us/coronavirus-death-toll-us.html
Ref 12: England & Wales: https://www.ons.gov.uk/peoplepopulationandcommunity/birthsdeathsandmarriages/deaths/datasets/monthlyfiguresondeathsregisteredbyareaofusualresidence
Scotland:
https://www.nrscotland.gov.uk/statistics-and-data/statistics/statistics-by-theme/vital-events/general-publications/weekly-and-monthly-data-on-births-and-deaths/monthly-data-on-births-and-deaths-registered-in-scotland
Northern Ireland:
https://www.nisra.gov.uk/statistics/births-deaths-and-marriages/deaths
Ref 13: https://www.worldometers.info/coronavirus/country/uk/
Ref 14: https://www.ons.gov.uk/peoplepopulationandcommunity/birthsdeathsandmarriages/deaths/datasets/monthlyfiguresondeathsregisteredbyareaofusualresidence
Ref 15: https://www.ons.gov.uk/peoplepopulationandcommunity/birthsdeathsandmarriages/deaths/articles/highestnumberofexcesswinterdeathssince19992000/2015-11-25
Ref 16: https://www.bbc.co.uk/news/health-30243635
Ref 17: https://www.cancerresearchuk.org/health-professional/cancer-statistics-for-the-uk
Ref 18: https://www.dailymail.co.uk/debate/article-8134803/Cancer-patients-condemned-lose-treatments-coronavirus.html
Ref 19: https://www.itv.com/news/2020-04-22/60-000-cancer-patients-could-die-because-of-lack-of-treatment-or-diagnosis-oncologist-on-coronavirus-dilemma/
Ref 20: https://www.youtube.com/watch?v=DHOoqdkj4Zs
(Transcript here: https://thefatemperor.com/wp-content/uploads/2020/05/Ep78-Stanford-Professor-and-Nobel-Prize-Winner-Explains-this-Viral-Lockdown-Fully-2.pdf page 10)
Ref 21: https://www.latimes.com/science/story/2020-03-22/coronavirus-outbreak-nobel-laureate


Thank you, From the States…
John.
COVID-19 sometimes causes serious problems other than death.
I would like to see statistics for these!
I don’t believe they are routinely collected and published.
How much should individuals be concerned about them?
Examples appearing in various articles:
Lung damage, up to and including the need for a double lung-transplant.
Blood clots and strokes.
Long term (too soon to say “permanent”) loss of taste or smell.
Apparently-new-onset psychosis.
Hi Barry
Very good point – I’ll stick that one on the list to look at when we get more data.
From early reports, the complications seem far more random and individual than the deaths. We have some robust data on death risk factors, but very little on complications. I am also seeing anecdotal reports of very fit people suffering legacy problems after having had the virus and being quite surprised by this (not unreasonably)
I heard that Prince Charles (who contracted the virus late March) still doesn’t have smell/taste back and I have friends with similar impaired time scales for this.
I’ve also heard from medical staff that kidneys have been hit more than lungs – dialysis machines being of more use than ventilators in their view.
There is so much we don’t know – I’ll write when things have data available!
Best wishes – Zoe