Prostate cancer – to screen or not to screen
Executive summary * A paper has just been published with updated results for the CAP trial. * The CAP trial
Read More

Executive summary * A paper has just been published with updated results for the CAP trial. * The CAP trial
Read More
Bio James Goolnik is a dentist with a Master’s degree in Conservative dentistry. James was previously President of the British
Read More
Introduction I recently needed to look up how much the main statin, Lipitor, had earned during its lifetime. This led
Read More
Executive summary I summarised the issues with this paper in a BMJ rapid response, which was published on March 11th
Read More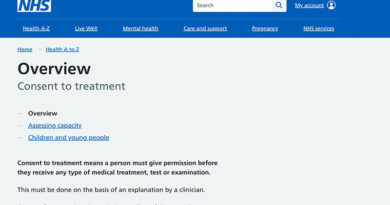
The recent “Why do you overeat?” note shared something that happened 20 years ago. This week’s note shares something that
Read More
Executive Summary * A recent presentation at an American Heart Association conference generated global headlines. It claimed that eating within
Read More
Bio Nick Thompson is a vet. He has been fighting for responsible, species-appropriate raw food feeding for pets for over
Read More
Introduction We’ve got a break from dissecting academic papers this week as it is almost 20 years to the day
Read More
Executive summary * Inspired by last week’s note about ‘the Atlantic Diet’, this week’s note compares the Atlantic and Mediterranean
Read More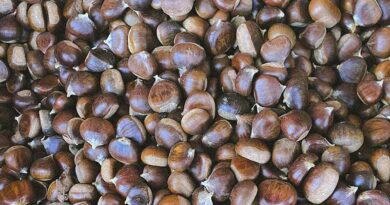
Executive summary * “The Atlantic Diet” made recent news headlines. The paper behind it was a re-look at a diet
Read More