
Designed by the food industry for wealth, not health: the ‘Eatwell Guide’
After a year, I am allowed to publish BJSM articles on my site, so here is my editorial on the ‘Eatwell Guide’ from 13th June 2016…
Introduction
The Balance of Good Health, a picture of a segmented plate, was launched by the UK Department of Health in 1994. In September 2007, this was relaunched by the Food Standards Agency as the Eatwell Plate. The changes were cosmetic. In March 2016, the Eatwell Plate was relaunched as the Eatwell Guide. Many of the changes were again cosmetic.
The Eatwell Guide was formulated by a group appointed by Public Health England consisting primarily of members of the food and drink industry rather than independent experts.
What changed?
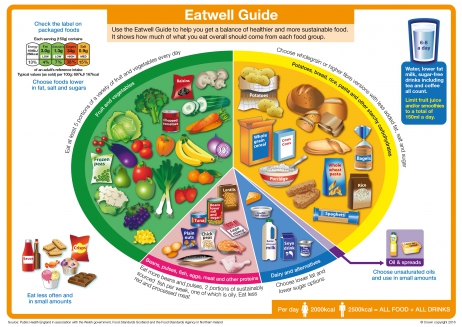
The Eatwell Plate became the Eatwell Guide; the knife and fork disappeared; the segment names were tweaked and the images on the plate became drawings, not photographs – looking even less like real food. None of this would have any impact on epidemics of obesity or type 2 diabetes.
The segment proportions changed: starchy foods increased from 33% to 38%; fruit and vegetables from 33% to 40%; “milk and dairy” became “dairy and alternatives” (soya) and almost halved from 15% to 8%; non dairy protein stayed at 12%, but was renamed to “beans, pulses, fish, eggs, meat and other proteins” (the incomplete vegetarian protein listed first and an ignorance of the difference between a food group and a macro nutrient demonstrated). The purple segment (previously foods high in fat and/or sugar) became (unsaturated) oils and spreads. Unilever’s response was to place adverts in national newspapers to celebrate their “dedicated section”.
The indefensible can of cola was removed. The biscuits, sweets, cakes, crisps and chocolate remain, however; moved from the purple segment to be given prominence on the bottom left of the diagram, along with ketchup and ice cream.
Evidence
The primary issue with the Eatwell Guide, as with its predecessors, is that it is not evidence based. There has been no randomised controlled trial of a diet based on the Eatwell Plate or Guide, let alone one large enough, long enough and with whole population generalisability.
Dietary advice to base meals on carbohydrates is the consequence of dietary advice to restrict fat. Protein is in all foods – except sucrose (arguably not a food) and oils/lard – and thus tends to comprise approximately 15% of energy intake. The introduction of a total fat recommendation of 30% of calories was concomitantly a population directive to consume 55% of energy in the form of carbohydrate [1]. The fat guidelines were without evidence base [2] and the carbohydrate advice was not tested. Not even the hydration message holds water [3].
The 2015 US Dietary Guidelines [4] are conspicuously silent on the subject of total fat. The recommendation appears to have been quietly dropped rather than confessionally reversed. The UK is behind the times.
Weight and calories
In 2009, in personal correspondence, the Food Standards Agency confirmed that the Eatwell Plate percentages were based on weight. Food weight matters little to the human body. Calories, macro and micro nutrients count. Given the vastly different calorie content of 100g of fruit and vegetables vs. 100g of oils, the plate proportions change substantially when calories are counted (Table 1):
| TABLE 1 | With junk included | Without junk | ||
| New Eatwell Guide | % in diagram | % calorie intake | % in diagram | % calorie intake |
| Starchy foods | 37% | 62% | 38% | 68% |
| Fruit & veg | 39% | 8% | 40% | 9% |
| Dairy & alternatives | 8% | 6% | 8% | 7% |
| Beans, pulses, fish, eggs, meat etc | 12% | 11% | 12% | 12% |
| Oils & spreads | 1% | 4% | 1% | 4% |
| Junk | 3% | 9% | ||
Table 1: Calculated from a selection of foods in each category from the US Department of Agriculture all foods database. (Starchy foods were 334 calories/100g; fruit and vegetables 43 cals/100g; dairy and alternatives 157 cals/100g; beans etc 180 cals/100g; oils & spreads 819 cals/100g.) The estimates can be debated, the general principles remain.
Without junk food, 68% of energy intake derives from starchy foods. The fruit and vegetable segment, intended to be the largest, forms just 8-9% of energy intake. The super foods – meat, fish and eggs – form a maximum of 11-12% of the diet, far less if beans and pulses (predominantly carbohydrate) are chosen. Highly nutritious dairy foods comprise just 6-7% of the new plate, while junk forms 9%.
The RCT?
Arguably the high-carb-low-fat diet has been tested on whole populations. In the UK, in 1972, 2.7% of men and 2.7% of women were obese and 23.0% of men and 13.9% of women were overweight. By 1999, obesity rates had risen to 22.6% of men and 25.8% of women, while 49.2% of men and 36.3% of women were overweight [5].
There were 800,000 people with diabetes in the UK in 1980, from a population of 56 million – an incident rate of 1.42% [6]. The diabetes rate in the UK in 2015 was 6.1% [7].
The association between the introduction of the dietary guidelines and concomitant increases in obesity and diabetes deserves examination. A number of recent reviews have suggested a causal connection [8-10].
The greatest flaw of the latest public health dietary advice might be the missed opportunity to deliver a simple and powerful message to return people to the diets we enjoyed before carbohydrate conditions convened. But when the who’s who of the food industry were represented on the group, Eat Real Food! was never a likely outcome.

References
- National Advisory Committee on Nutritional Education (NACNE). A discussion paper on proposals for nutritional guidelines for health education in Britain. London: The Health Education Council, 1983.
- Harcombe Z, Baker JS, Cooper SM, et al. Evidence from randomised controlled trials did not support the introduction of dietary fat guidelines in 1977 and 1983: a systematic review and meta-analysis. Open Heart 2015;2(1) doi: 10.1136/openhrt-2014-000196[published Online First: Epub Date]|.
- McCartney M. Waterlogged? BMJ 2011;343 doi: 10.1136/bmj.d4280[published Online First: Epub Date]|.
- U.S. Department of Health and Human Services and U.S. Department of Agriculture. 2015 – 2020 Dietary Guidelines for Americans. 8th Edition.: Available at http://health.gov/dietaryguidelines/2015/guidelines/. 2015.
- Michael Wadsworth, Diana Kuh, Marcus Richards, Hardy. R. Cohort Profile: The 1946 National Birth Cohort (MRC National Survey of Health and Development). Int J Epidemiol 2006;35:49-54 doi: 10.1093/ije/dyi201[published Online First: Epub Date]|.
- Diabetes UK. Diabetes in the UK 2004: A report from Diabetes UK October 2004. Available at www.diabetes.org.uk/Documents/Reports/in_the_UK_2004.doc, 2004:27.
- Diabetes UK. Diabetes: Facts and stats. Available at https://www.diabetes.org.uk/Documents/Position%20statements/Facts%20and%20stats%20June%202015.pdf, 2015:22.
- Lawrence GD. Dietary Fats and Health: Dietary Recommendations in the Context of Scientific Evidence. Advances in Nutrition: An International Review Journal 2013;4(3):294-302 doi: 10.3945/an.113.003657[published Online First: Epub Date]|.
- DiNicolantonio JJ. The cardiometabolic consequences of replacing saturated fats with carbohydrates or Ω-6 polyunsaturated fats: Do the dietary guidelines have it wrong? Open Heart 2014;1(1) doi: 10.1136/openhrt-2013-000032[published Online First: Epub Date]|.
- Hansen A. Swedish health advisory body says too much carbohydrate, not fat, leads to obesity. BMJ 2013;347 doi: 10.1136/bmj.f6873[published Online First: Epub Date]|.


Hi Zoe, I’m a type 2 diabetic and recently did a NHS DESMOND course (Diabetes Education and Self Management for Ongoing and Newly Diagnosed) on how to manage my diabetes. The Eatwell Guide was shown as an ideal proportion of food that I and other type 2s should be eating. They even had a plastic plate with the sections in for us to look at, a third of which was bread, potatoes, pasta, rice, cous cous etc.
Bearing in mind that diabetics can’t eat loads of carbs without getting spikes in blood sugar levels, or higher blood sugar levels all day if we eat carbs through the day, it was a bit of a shock to hear that a third of my food should be carbs. I’m not sure what sort of longer outcome eating the proportions of the eatwell plate would give me, but managing my diabetes to reduce the risk of complications from high blood sugar isn’t likely to be one of them.
I’m disappointed that the official diet guidance offered me and other Type 2 diabetics is so poorly matched to what we can process with our less than fully functioning pancreases!
Cheers for your interesting article (and the one on conflicts of interests in creating the Eatwell Guide). They allowed me to make the decision to continue to eat a lower carb diet and ignore the carbohydrate section of the Eatwell Guide.
Hi Sarah
Many thanks for sharing this. So many people with type 2 work out for themselves that carbs raise blood glucose and yet why should they need to work that out for themselves?! It’s not right and it makes no sense until you follow the money (roll eyes icon!)
If you put type 2 diabetes in the search box on this site, there should be many more interesting articles – many on open view.
Best wishes – Zoe
There is no doubt that nowadays people are fatter than ever. But whenever I see percentages of population that are obese and overweight I have instant doubts. I’m an auditor and I use statistical sampling whenever it would not be cost effective to test the whole population. For my tests I use statistical parameters to determine an appropriate sample size to select for the planned control test: confidence level, expected deviation rate, tolerable rate, and population. To the best of my knowledge nothing of this sort has been used to determine the published rates of obesity and overweight individuals. Neither has every inhabitant of a nation been weighted by the agencies that provide these numbers.. The question is where do this numbers come from?
You don’t mention the algorithm used to formulate these percentages and recommendations in the blog. What is your take on it? While with med diet we can argue over the wholegrain and niggle over the quantity of red meat most ppl agree on lots…something no one likes to mention by the way as we prefer to have B&W sides. However, plug whatever version into algorithm which takes into account current population diet and final diet swaps are compromised. I’m not a fan (and too often misused) and know you are not but is a major obstacle in pop level advice this methodology that compromises the health messages? Cheers.
Hi Dan
What algorithm are you referring to?
Best wishes – Zoe
Buried in the methodology section. After they’ve adjusted for sustainability they also adjust the recommendations based on the current NDNS data including (though not well stated and had to clarify with someone at PHE who still wasn’t 100%) proportions. In essence Eatwell is not designed as a final destination but a moving target based on the easiest changes and swaps a population can currently make.
Hi Dan
Thanks for this – I’m still not sure what you’re asking. I don’t think what they did matters as much as what they end up with. The points I make in the editorial are:
1) This was designed by the ‘food’ industry – more here https://www.zoeharcombe.com/2016/03/eatwell-guide-conflicts-of-interest/
2) Segments changed – especially dairy – and generally moved even further away from real food (see 1!)
3) The plate/guide is not evidence based
4) The segment proportions are based on weight and the calorie implications are substantial
5) We’ve got a lot fatter and sicker since our high carb low fat advice – maybe it’s time to rethink?!
Final destination, moving target – whatever it is – it sucks!
Best wishes – Zoe
Agree the methodology is just as important to understand.
1) There is some irony in PHE being recently told they are bias in favour of red meat having been told they are biased against for so long. If we produced low carb guidelines another sector of industry would be shouting it’s praises (not all ‘real’ food)…maybe some sectors are just more palatable than others.
2) Can blame 1 if want but this is where methodology and my point comes in. There is a belief we need gradual nudge changes and so change is based on where we are with current diet. As much as we all hate it fresh produce (real is a rubbish term) is not common enough in current diet therefore the methodology purposes swaps which are believed to be more palatable. Unless lose this methodology whatever you plug in you get undesirable steps back.
3) No plate with proportions is evidenced based. There are rare but small RCTs and obvs analysis of EatWell style eating but after the fact. Our science is dominated by weight loss so few studies look at general populations. There is no one, evidenced, healthy way of eating thus a single plate/pyramid etc can’t show this. We can theorise but evid applicable to pop health is limited.
4) The segmentation as pointed out above is a mess and confusion over kcal or g means public have no idea.
5) Need more data than that and as a statistician you know this is lazy epidemiology. Took over 50y+ data from over 30 countries to get close to showing removing lead from petrol reduced violent crime. We’ve also got more obese since car ownership increased, since TV became color and the number of channels increased etc etc. Let’s fight bad applications of science with good ones at least.
Maybe part of the debate needs to be if all sectors of the public from poorest to richest can make bigger leaps.
The population made a pretty damn BIG leap when “low fat” diets were introduced. Probably because they actually believed their life depended on it.