Gary Taubes and Zoë chat about science, diabetes, journalism and books
Bio Gary Taubes is an investigative science and health journalist and co-founder of the non-profit Nutrition Science Initiative (NuSI.org). He
Read More
Bio Gary Taubes is an investigative science and health journalist and co-founder of the non-profit Nutrition Science Initiative (NuSI.org). He
Read More
Executive summary * A paper has recently been published about a three-way intervention trial (involving 155 people) conducted in New
Read More
Executive summary * This week’s note is about another paper from the Harvard factory. This one claimed that plant protein
Read More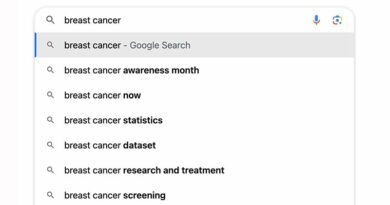
Executive summary * This is the second of a two part note trying to answer the question – breast cancer
Read More
Bio Dr. Georgia Ede is a Harvard-trained psychiatrist specializing in nutrition science, brain metabolism, and mental health. Her two decades
Read More
Executive summary * This is the first of a two part note trying to answer the question – breast cancer
Read More
Executive summary * A paper was published in November 2023, which claimed that people who adhered most closely to the
Read More
Executive summary * Population studies typically involve tens or hundreds of thousands of people. This population study involved 702 people
Read More
Happy New Year! We’re kicking off with a review of last year. As many people think about diet at this
Read More
Bio Gareth Wyn Jones is a heritage hill farmer and a modern social media communicator. He was born in the
Read More