
What the UK eats (2014)
A comprehensive survey detailing what UK people eat has been available since 1940. It was called the National Food Survey from 1940 until 2000 and has been called the Family Food Survey since 2002.
The most recent Family Food Survey was published in December 2015 for 2014 data. It can be seen here. The next issue is due out in March 2017, so this is the most recent data available (at the time of this post).
In the “Family Food 2014” document, Table 3.3 is the main summary table for intakes by food category. The breakdown by energy intake is as follows:
| All Food (average per person per day) | Kcal | As % of diet | |
| 1 | Milk & Cream | 162 | 8.5% |
| 2 | Cheese | 56 | 2.9% |
| 3 | Carcase Meat | 53 | 2.8% |
| 4 | Non carcase Meat & Meat Products | 203 | 10.6% |
| 5 | Fish | 29 | 1.5% |
| 6 | Eggs | 17 | 0.9% |
| 7 | Fats & oils | 155 | 8.1% |
| 8 | Sugar and preserves | 55 | 2.9% |
| 9 | Fresh & processed potatoes | 42 | 2.2% |
| 10 | Fresh green vegetables | 5 | 0.3% |
| 11 | Other fresh vegetables | 18 | 0.9% |
| 12 | Processed vegetables | 126 | 6.6% |
| 13 | Fresh fruit | 44 | 2.3% |
| 14 | Processed fruit | 52 | 2.7% |
| 15 | Bread | 185 | 9.7% |
| 16 | Flour | 26 | 1.4% |
| 17 | Cakes, buns & pastries | 71 | 3.7% |
| 18 | Biscuits | 109 | 5.7% |
| 19 | Other cereal products | 247 | 12.9% |
| 20 | Beverages | 5 | 0.3% |
| 21 | Other foods | 79 | 4.1% |
| 22 | Soft drinks | 40 | 2.1% |
| 23 | Confectionery | 82 | 4.3% |
| 24 | Alcoholic drinks | 56 | 2.9% |
| TOTAL | 1917 | 100.0% |
Some observations
* Calorie intake looks low. The October 2011 Public Health England ‘obesity strategy’ actually increased recommended calorie intake per day from 2,550 to 2,605 for men and from 1,940 to 2,079 for women. The average of 1,917, covering men and women, suggests under-reporting.
* Real food can be found in rows 1, 2, 3, 5, 6, 9, 10, 11 and 13. This amounts to 426 calories – 22% of the total. 78% of what the UK eats is fake food. (Natural fats like butter and lard should be separated from highly processed vegetable oils to be able to allocate real fats to the real food category and vegetable oils to the fake food category.)
* Red meat (see here and here) is invariably lumped in with processed meat in studies that try to demonise all meat intake together. The average UK person consumes four times as much processed meat and meat products (that will include pies/pasties/sausage rolls and other carb enclosed stuff) as carcase meat. We record these intakes separately and academic studies are able to analyse them separately. They rarely do so.
* The Soft Drinks Association is fond of telling us that soft drinks account for just 2% of calorie intake. This is true (40 calories, 2.1%), but a) it’s a totally empty calorie intake and b) it’s approximately the same as our daily calories from fresh fruit (44 calories) and almost twice our calories from fresh vegetables. The soft drinks calorie intake also exceeds that of fish and is more than twice our calorie intake for eggs.
* One of the reasons I don’t attack soft drinks alone is this 2% figure. The main dietary culprit is sugar – nutritionally void and omnipresent. Sugar is in every fake food above with the exception of fats and oils. Sugar is thus in rows totaling 1,336 calories – just under 70% of UK calorie intake. Without sugar (and/or artificial sweeteners) there would be no: confectionery; soft drinks; cakes; buns; pastries; biscuits; processed fruit; sugar and preserves. Without sugar the following rows would also be decimated: cereal; bread; meat products (pies etc) and other food products (Ref 1) in the UK diet.
If we could cut sugar alone from the human diet it is difficult to see how obesity could prevail – or much of the chronic illness now suffered by so many people: diabetes; cancer; cardiovascular disease and so on.
Check table 3.8 in the Family Food Survey 2014 to see average nutrient intake – for the fat soluble vitamins especially: 489μg retinol (don’t assume that carotene can be converted); 3.08μg vitamin D and 12.09mg vitamin E. The US recommended intake of vitamin D is 15μg daily. Even with the UK (Ref 2) guideline of 10μg, the average UK intake is not even one third of this. In October 2013, the Chief Medical Officer for England said that the country should be “profoundly ashamed” that rickets had returned to the UK. Government dietary advice, demonising as it does real food and natural fats, has achieved this. That’s what Dame Sally Davies should be profoundly ashamed of.
* Table 2.1 on Page 10 of the document tells us that the average Brit consumed 40g of butter per week – that’s less than 6g a day – that’s probably the amount left on the knife after buttering something! And public health advisors think that butter makes us fat. Ha ha! Contrast this with the 806 calories per day of the starchy foods that the government tells us to eat (rows 9, 12, 15, 16, 17, 18 and 19).
* The same Chief Medical Officer recently lamented that “obesity has become the norm.” Look no further than what we’re eating and what you’re telling us to eat.
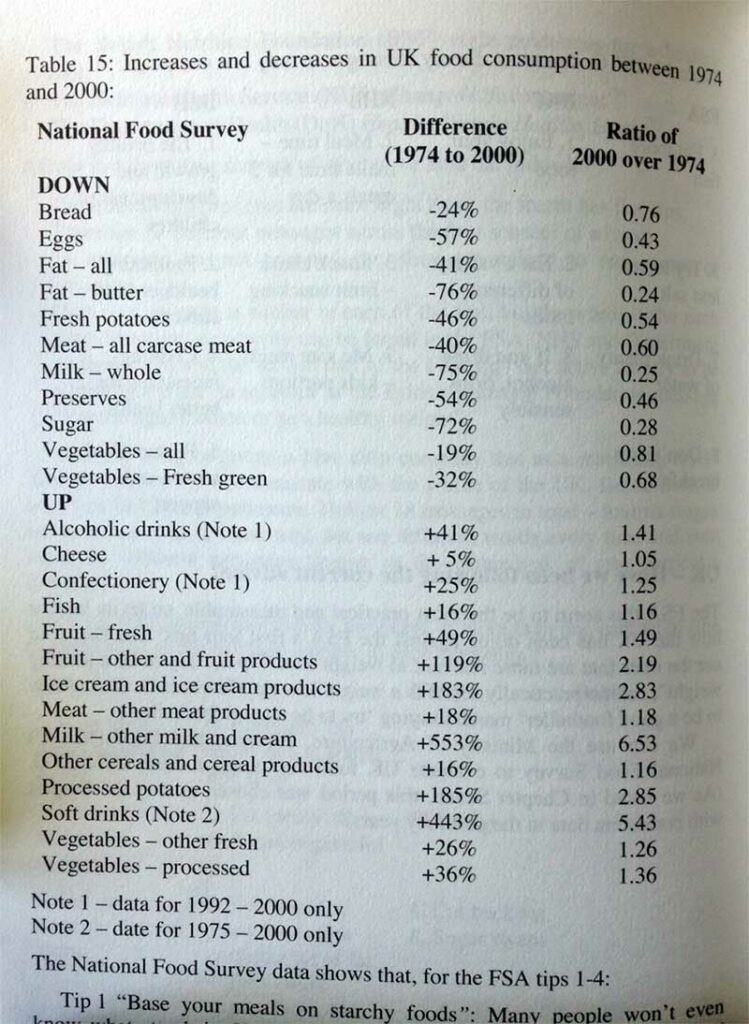
p.s. “Rob” asked for info on how our diet has changed, during the period of escalating obesity. This is an extract from my 2010 book “The Obesity Epidemic: What caused it? How can we stop it?” The period 1974 – 2000 covers the introduction of the dietary guidelines up to the point the National Food Survey data stopped. It also covers the period during which UK obesity rose from 2.7% for men and women (1972) to 22.6% for men and 25.8% for women (1999).

References
Ref 1: Other food products includes: mineral or spring waters, baby foods, soups, other takeaway food brought home, meals on wheels, salad dressings and other spreads & dressings, pickles, sauces, takeaway sauces and mayonnaise, stock cubes and meat & yeast extracts, jelly squares or crystals, ice cream (all types), salt, artificial sweeteners, vinegar, spices and dried herbs, bisto, gravy granules, stuffing mix, baking powder, yeast, fruit, herbal and instant teas, and soya and novel protein foods.
Ref 2: Department of Health report 41, Dietary Reference Values for Food Energy and Nutrients for the united Kingdom.


Would be interesting to compare the above table to data from previous years, say at 10 year intervals for simplicity to show how out diet has changed during the era that obesity has become so common.
Hi Rob
I did this in my obesity book back in 2010. I took the National Food Survey period from 1974 to 2000 – during which time UK obesity rose almost tenfold (from 2.7% for men and women to 22.6% for men and 25.8% for women). I’m trying to work out how to insert a pic of the page – watch this space!
I’m doing regular updates of the UK recent surveys.
https://www.zoeharcombe.com/2014/03/what-the-uk-eats2012/
https://www.zoeharcombe.com/2013/11/what-the-uk-eats-2011/
Bye for now – Zoe
p.s. added the pic in the main blog post – thanks for the question :-)